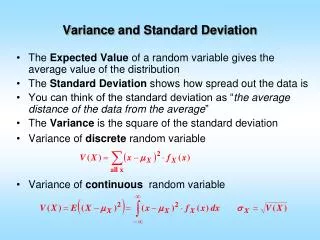
Effects of Uniform Data Changes on Range, Interquartile Range, Variance and Standard Deviation
160 likes | 412 Vues
Effects of Uniform Data Changes on Range, Interquartile Range, Variance and Standard Deviation. 14, 16, 20, 18, 22. Find range, interquartile range, variance and standard deviation for the set of data above. 14, 16, 20, 18, 22. Range = 22 – 14 = 8. 14, 16, 18, 20, 22. First Quartile = 15,

Effects of Uniform Data Changes on Range, Interquartile Range, Variance and Standard Deviation
E N D
Presentation Transcript
Effects of Uniform Data Changes on Range, Interquartile Range, Variance and Standard Deviation
14, 16, 20, 18, 22 Find range, interquartile range, variance and standard deviation for the set of data above.
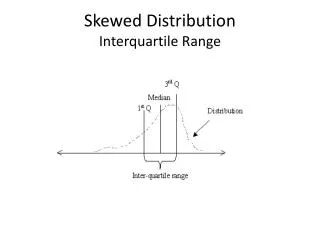
14, 16, 20, 18, 22 Range = 22 – 14 = 8 14, 16, 18, 20, 22 First Quartile = 15, Third Quartile = 21 Interquartile range = 21 – 15 = 6
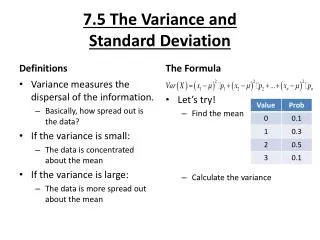
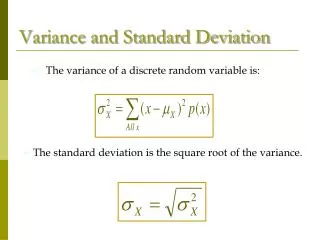
14, 16, 20, 18, 22 Mean = (14+16+20+18+22)5 = 90 5 = 18 Sum of squared deviation from the mean =(14 – 18)2 + (16 – 18)2 + (20 – 18)2 + (18 – 18)2 + (22 – 18)2 = (-4)2 + (-2)2 + (2)2 + (0)2 + (4)2 = 40 Variance = 40 5 = 8 Standard Deviation = sqrt(8) = 2.828
14, 16, 20, 18, 22 If each data in the set is added a constant value of 5, find: a) range, b) interquartile range, c) variance and d) standard deviation for the new set of data above.
14+5, 16+5, 20+5, 18+5, 22+5 New set of data: 19, 21, 23, 25, 27 New Range = 27 – 19 = 8 New First quartile = 20 New Third quartle = 26 New Interquartile range = 26 – 20 = 6
14+5, 16+5, 20+5, 18+5, 22+5 New set of data: 19, 21, 23, 25, 27 New Mean = 18 + 5 = 23 Sum of squared of deviation from the mean = (19 – 23)2 + (21 – 23)2 + (23 – 23)2 +(25 – 23)2 + (27 – 23)2 = (-4)2 +(-2)2 + 02 + (2)2 + (4)2 = 40 Variance = 40 5 =8 Standard deviation = sqrt(8) = 2.828
Effect 14, 16, 20, 18, 22, Range = 8 Interquartile range = 6 Variance = 8 Std. Dev = 2.828 19, 21, 25, 23, 27, Range = 8 Interquartile range = 6 Variance = 8 Std. Dev = 2.828
Conclusion:Effects on Range, Interquartile Range, Variance and Standard Deviation when the data is added/substractedby a constant k isNO CHANGE
14, 16, 20, 18, 22 If each data in the set is MULTIPLIED BY a constant value of 5, find: a) range, b) interquartile range, c) variance and d) standard deviation for the new set of data above.
145, 165, 20 5, 18 5, 22 5 New set of data: 70, 80,100, 90,110 New Range = 110 – 70 = 40 New First quartile = 75 New Third quartle = 105 New Interquartile range = 75 – 105 = 30
New set of data: 70, 80,100, 90,110 New Mean = 18 5 = 90 Sum of squared of deviation from the mean = (70 – 90)2 + (80 – 90)2 + (100 – 90)2 +(90 – 90)2 + (110 – 90)2 = (-20)2 +(-10)2 + (10)2 + (0)2 + (20)2 = 1000 Variance = 1000 5 =200 Standard deviation = sqrt(200)= 14.14
Effect 14, 16, 20, 18, 22, Range = 8 Interquartile range = 6 Variance = 8 Std. Dev = 2.828 70, 80,100, 90,110 Range = 40 Interquartile range = 30 Variance = 200 Std. Dev = 14.14
Conclusion:Effects on Range, Interquartile range, Variance and Std Dev when the data is MULTIPLIED by a constant k isnew range = koriginal rangenew interquartile = koriginal Interquatilenew variance = k2original variancenew std. dev = k original std.dev