Download
1 / 47
470 likes | 628 Vues
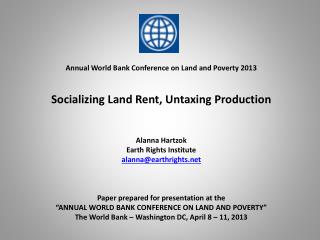
Estimation of Land and Inventory Stocks by Industries as Capital Inputs in Korea*. Conference on Growth and Stagnation in the World Economy, The Third World KLEMS Conference, Tokyo, Japan, May 19-20, 2014. Hak K. Pyo and Keun Hee Rhee**.

E N D
Estimation of Land and Inventory Stocks by Industries as Capital Inputs in Korea* Conferenceon Growth and Stagnation in the World Economy,The Third World KLEMS Conference, Tokyo, Japan, May 19-20, 2014 Hak K. Pyo and KeunHee Rhee** *An earlier version of this paper was presented at Seminar on Estimation of Land and Inventory Stocks for Asia KLEMS Database, Statistics Directorate, OECD, Paris, November 21, 2013 and at Meeting on Harmonization of Japan Industrial Database with Asia KLEMS Database on January 11, 2013, and at Meeting on Estimation of Land and Inventory Stocks for Asia KLEMS Database on April 25, 2013 at RIETI in Tokyo, Japan ** Visiting Scholar, Korea Institute for International Economic Policy and Professor Emeritus, Seoul National University and Senior Fellow, Korea Productivity Center respectively. All correspondences should be addressed to pyohk@plaza.snu.ac.kr
Outlines 1. Introduction 2. Estimation of Land by Industries 3. Estimation of Inventory Stocks 3. 1 Harberger’s Method 3. 2 The Acceleration Model 3. 3 A Modified Benchmark-Year Estimation Method 4. Conclusion
1. Introduction • Mamalakis(1992): Broadening the coverage of capital stock may entail too many imputations and measurement error. Land is not produced means of production. • Goldsmith (1975): Land is the most difficult component of national wealth to estimate. • Nomura (2004): Inventory stocks should be defined as a capital because it is a means-of-production and used over one year accounting period. • But it is not a durable good and has no depreciation and therefore, cannot be estimated by PIM (Perpetual Inventory Method) • There have been two groups: (1) Exclusion of Land and Inventory Stocks: BEA (1993), EU KLEMS (2007) and National wealth Survey (1968, 1977, 1987, and 1997) in Korea (2) Inclusion of Land and Inventory Stocks: Goldsmith (1975) Kendrick (1976), Jorgenson, Gollop and Fraumeni (1987) and OECD (2009)
Inclusion of Land and Inventory Stocks: Important for Asia KLEMS • Land is an important part of productive stock which generates capital services to production activities • The significant portion of national income accrued to capital is rents to land of owner-occupied residential structure and tenant- occupied residential and non-residential structure. • The economies with a large agricultural sector such as Asia KLEMS member countries need to include land and inventory stocks to impute capital services and rates of return without too much bias (EU KLEMS, 2007, p. 34)
Inclusion of Land and Inventory Stocks: Important for Asia KLEMS • Jorgenson, Gollop and Fraumeni (1987): • producers’ durable equipment • Consumers’ durable equipment • Tenant-occupied residential or non-residential structure • Owner-occupied residential structure • Inventory • Land • OECD defines four types of land: • Natural land under buildings and structures and associated surface water • Natural land under cultivation and associated surface water • Natural recreational land and associated surface water • Other natural land and associated surface water
Inclusion of Land and Inventory Stocks: Important for Asia KLEMS • 1993 SNA defines four categories of inventory stocks: • Materials and Supplies • Finished Goods • Goods purchased for resale and • Work-in-progress. • It should be noted that National Wealth Survey in Korea includes all three categories except Construction-in-progress which is a part of Work-in-progress. • National Wealth Survey treats Construction-in-progress as a part of fixed tangible assets. • It also includes Construction-in-progress not all of Work-in-progress in the fixed tangible assets because 93 definition of Work-in-progress is so wide that some other types of Work-in-progress may not be regarded as capital inputs.
Inclusion of Land and Inventory Stocks: Important for Asia KLEMS Value of Land • 2008 SNA (Paragraph 13.44) states: In principle, the value of land to be shown under natural resources in the balance sheet is the value of land excluding the value of improvements, which is shown separately under fixed assets, and excluding the value of building on the land which is also to be shown separately under fixed assets. • Land is valued at its current price paid by a new owner excluding the costs of ownership transfer which are treated by convention, as gross fixed capital formation and part of land improvements and are subject to consumption of fixed capital. In terms of inventory stocks, we need to decide whether we should include all of Work-in-progress in the inventory stocks.
Developing Asia has undergone significant transformation <Figure 1> Employment and Output Shares, Developing Asia: Compare 1975 with 2010 Source: Brooks(2013), “Asia’s Economic transformation: Where to, How, and How Fast?”, The Second Asia KLEMS conference
but agriculture is still a larger employer than in other regions <Figure 2> Employment and Output Shares, Developing Asia: 2010 or latest Source: Brooks(2013), “Asia’s Economic transformation: Where to, How, and How Fast?”, The Second Asia KLEMS conference
2. Estimation of Land by Industries Based on Pyo(1992)
2. Estimation of Land by Industries • As noted in Pyo (1992), the Study Report by the Committee for the Public Concept of Land (here-in-after called the Land Report for simplicity) published in 1989 was the first economy-wide benchmark estimates of land. • The report contains estimates of land by types of land as of January 1 of 1985. According to the report, the share of agricultural land (paddy field, ordinary fields and forest land) and that of non-agricultural land (land for buildings and structures, plant sites and others) in value was 32.8 percent and 67.2 percent respectively. • However, there is no information on industrial composition of non-agricultural land. At Mining and Manufacturing level, there have been Mining and Manufacturing Census and Reports which includes the value of land in manufacturing establishments at the beginning of year, value increase and decrease during the year and at the end of year.
2. Estimation of Land by Industries • Another potential source of estimates of land is Financial Statement Analysis published by the Bank of Korea but it only covers listed firms’ data in selected industries. • Economic Census in 2010 by the Statistics Korea was conducted on all establishments engaged in industrial activities to provide products or services at or within one geographic area, such as a factory, a shop, a mine, a business office, a branch office or a head office.
2. Estimation of Land by Industries • Estimates of Land(1954-1990) • We have found the fact that the data on land are typically available by the zoning area not by industries. But fortunately we found that Establishment Census in 1987 reported the size (not value) of land by industries. • In order to make use of Establishment Census, we have taken following steps to estimate value of land by industries:
2. Estimation of Land by Industries • Estimates of Land(1954-1990)(cont.) 1) We deflated the 1985 value estimate of land by the average land price index for the entire nation to convert the estimate into constant price series. Since the index is available only after 1985, we had to backcast the index by regressing it on the Metropolitan Land Price Index which is available since 1964. Then, the backcasted index during 1964-1974 and the observed index during 1985-1989 are regressed on the index of GNP deflator to backcast further for the period of 1953-1963. The combined series of the average land price index has been used to deflate the 1985 value estimate of land. 2) Even in real terms, it is difficult to assume that the value of land remained constant over 25 years between 1953 and 1989. Therefore, for the period of 1953-1984, we subtracted the amount of land improvement and orchard development in 1985 constant prices which appear in national income accounts from the 1985 value estimate of land.
2. Estimation of Land by Industries • Estimates of Land(1954-1990)(cont.) 3) Additional adjustment has been made to account for the change in agricultural land. According to the Land Report (1989), the total area of agricultural land has increased from 1,970 thousand ha in 1950 to 2,144 thousand hectare in 1985 for 2,000 farm households. Therefore, for the period of 1953-1984, we calculated the proportional area of agricultural land increase in value and subtracted it from the estimate of the agricultural land. The difference was allocated to the nonagricultural land. 4) We allocated the value estimate of paddy fields, ordinary fields and forest land to Agriculture, Forestry & fishing. The land for buildings and structures needs to be decomposed into residential land and nonresidential land before being allocated to non-agricultural industries. We assumed that about 7.2 percent (205.7km2) of the total unincorporated private land (2,847.4km2) for buildings and structures belong to the unincorporated business.
2. Estimation of Land by Industries • Estimates of Land(1954-1990)(cont.) 5) We also allocated the value estimate of the plant site to the Manufacturing and Electricity, Gas & Water industry only. 6) Finally, the sum of 7.2 percent of the unincorporated private nonresidential land and other types of land is allocated to all industries using the weights of land space by industries in 1986 Establishment Census. 7) The resulting estimates of land are compared with estimates of other wealth components which are more readily available in current prices. The share of land in Gross National Wealth was estimated to be 32.2 % in 1954 but increased to 44.7 % level in 1968 and then declined to reach 34.3 % in 1990.
2. Estimation of Land by Industries • Estimates of Land(1954-1990)(cont.) <Table 1> Summary Estimates of National Wealth of Korea(1953-1990) Unit: Billion Won, Current prices, (%) Source: Pyo(1992), Table 1
2. Estimation of Land by Industries • Estimates of Land(1954-1990)(cont.) • Goldsmith (1975) used the value land/structure ratio to estimate the value of non-agricultural land in his study. Starting from the estimate (0.39) for 1904 of Japan by Igarashi and Takahashi, he assumes that it had risen over time and reached in the neighborhood of unity in 1970. • However, as he admitted the method of applying the land/structure ratio to estimate the value of land is quite questionable due to the divergence between the book-value ratio and the market-value ratio and the lack of a comprehensive survey on both land and structures. • According to Goldsmith (1975), the urban land price index in Japan has risen almost 4,600 times between 1936 and 1970 while the urban area has expanded by a little over one-third. According to Pyo (1992), the land price index in Korea has risen 2,310 times between 1953 and 1990.
2. Estimation of Land by Industries • Estimates of Land after 1990 • A synthetic estimation of land after 1990 can be made by making use of National Wealth Survey published by Statistics Korea for the period of 1997-2010. • Statistics Korea had conducted the fourth since 1968 and the last national wealth survey in 1997 but it included fixed reproducible tangible assets, inventory stocks and consumer durable and semi-durable goods not land. • Therefore, there are two alternative methods to make a synthetic estimation of land after 1990. One is to extend the series of 1953-1990 by making use of some flow data (1970-1998) such as land improvement and orchard improvement in Table 4 to the stock of 1990. The imputed deflator for land improvement increased by 22.1 times between 1970 and 1998.
2. Estimation of Land by Industries • Estimates of Land after 1990(cont.) • However, the Bank of Korea no longer publishes the data after 1998. • We can make use of Mining and Manufacturing Reports which includes the value of land at the beginning of establishments, increase and decrease of the value during the year and the value of land at the end of the year as summarized in Table 5 of the paper. • These are book values reported by establishments. The data in 2010 seems from Economic Census conducted in 2010 which reports from firm-level survey not establishment survey and therefore, cannot be relayed to the series before 2010.
2. Estimation of Land by Industries • Estimates of Land after 1990(cont.) • Another alternative source of estimates of land is Balance Sheet data in Financial Statement Analysis compiled by the Bank of Korea as summarized in Table 6 of the paper. • The data covers only listed firms in selected industries and therefore cannot be regarded as economy-wide estimates of land by business establishments. • For the period of 2008-2011, the value of land occupied about 18 % of total value of non-current assets.
2. Estimation of Land by Industries • Estimates of Land after 1990(cont.) <Table 2> Value of Land on Balance Sheet Unit: Billion Won, Current prices, (%) Source: The Bank of Korea, Financial Statement Analysis, 2011
2. Estimation of Land by Industries • Estimates of Land after 1990(cont.) • For the period of 1980-2011, the estimates of fixed reproducible tangible assets are available from Pyo (2012) as shown in Tables 7-10 of the paper. • The estimates of residential buildings and nonresidential buildings and structure can be used to impute the value of land on which they were built. • A preliminary report by the Bank of Korea (2012) suggests to apply 40 % to impute land value of all nonresidential buildings and structures, 65 % to impute land value of all residential buildings and about 50 % to impute land value of all Agricultural land, Forest land and public and other land from National Wealth estimates of Statistics Korea.
2. Estimation of Land by Industries • Estimates of Land after 1990(cont.) • The report estimates the economy-wide value of land as of the end of 2010 as 5,300 trillion Won at market prices which is greater than the sum of land value (3,536 trillion Won) evaluated at the public-notice prices announced by the Ministry of Land, Transport and Maritime Affairs and estimate of land (3,568 trillion Won) in National Wealth compiled by Statistics Korea (2011) which occupies 69.2 % of all national wealth total (7,778.6 trillion Won) as summarized in Table 11 of the paper. • Therefore, the valuation of land makes a great difference among estimates depending on what price index of land are used. On the other hand, Statistics Korea’s Economic Census (2010) reports Land (274 trillion Won), Building (185 trillion Won) and Structure (60 trillion Won) as of the end of 2010 from the 254,373 total number of enterprises being surveyed.
2. Estimation of Land by Industries • Estimates of Land after 1990(cont.) • Therefore, even after applying 50 % valuation of land for Building and Structure, we still end up with an estimate of total land of 396.5 trillion Won which is only 11.1 % of their own estimate of land (3,568 trillion Won) on National Wealth. • This illustrates how little can be covered from establishment surveys as far as estimation of land is concerned because residential land, agricultural land and other public-use land are not included in the establishment surveys.
2. Estimation of Land by Industries • Estimates of Land after 1990(cont.) <Table 3> National Wealth by Types of Assets Unit: Trillion Won, (%) Source: Statistic Korea (2011)
2. Estimation of Land by Industries • Estimates of Land after 1990(cont.) --------------------------------------------------------------------------------------- 1. Bank of Korea (2012) (Residential building, 65%), (Nonresidential building and structure, 40%) 5,300 2. Ministry of Land, Transport and Maritime Affairs (2011) 3,536 3. Statistics Korea, National Wealth (2011) Tangible Fixed Assets 3,380 (1,690) Land 3,568 Imputed Total Land 5,258
4. Statistics Korea , Economic Census(2012) (All industries) Building 185 (93) Structure 60 (30) 123 Land 274 397(100%) (Manufacturing) Building 58 (29) Structure 9 (4) 33 Land 86 119(30.0%) 5. Pyo and Rhee(2012) Residential Building 878 Non residential building 957 Structure 1,254 3,089 (1,545) 3,536
6. Pyo and Rhee (2013) based on land tax records - Taxable Land 1, 151.3 - Land subject to non-taxation, reduction and exemption 706.0 1.857.3 (a) - Taxable Structures and Houses 1,564.3 - Structures and Houses subject to non-taxation, reduction and exemption 154.5 1,718.8 (b) - Land/Structure Ratio: (a)/(b)=1.85/1.72 ------------------------------------------------------------------------------
2. Estimation of Land by Industries • As shown in Table 4, total tax base of land in Korea which was subject to the land property tax in Korea in 2011 is estimated to be a total of 1,857.3 trillion Won with 1,151.3 trillion Won of taxable land and 706.0 trillion Won of land subject to non-taxation, reduction and exemption. • On the other hand, total tax base of Buildings and Structures and Houses in Korea in 2011 is estimated to be a total of 2,012.0 trillion Won (1,857.3 trillion Won of Buildings and Structures and 154.7 trillion Won of Houses) with a total of 1,564.3 trillion Won of Taxable Buildings and Structures and Houses (335.9 trillion Won of Buildings and Structures and 1,228.4 trillion Won of Houses) and a total of 154.7 trillion Won of Buildings and Structures and Houses subject to non-taxation, reduction and exemption (104.5 trillion Won of Buildings and Structures and 50.2 trillion Won of Houses). • Therefore, the overall Land/Structure ratio in valuation in Korea in 2011 is estimated to be around 1.8/2.0 which is close to 1.0 quoted in Goldsmith (1975) from Igarashi and Takahshi’s study on Japan’s estimate of Land/ Structures.) • Annual Report of Local Tax Administration
2. Estimation of Land by Industries • Estimates of Land after 1990(cont.) <Figure 3> Comparative Estimates of Land (2010) Unit: Trillion Won, (%) Source: Bank of Korea(2012), Ministry of Land, Transportation and Maritime Affairs(2011), Statistic Korea, National Wealth(2011), Statistic Korea, Economic Census(2012), Pyo and Rhee(2012)
3. Estimation of Inventory Stocks • Harberger’s Method (1) I = Three-year moving average of investment during three normal years δ = Depreciation rate - Building(2.5%), - Machinery and Equipment(8%) - Inventory stocks(0%)
3. Estimation of Inventory Stocks <Assumption> There will not be great deal of errors in estimating inventory stocks by using the ratio of inventory investment to GNP <Example> The ratio of accumulated inventory investments to accumulated incremental GNP is multiplied by 1955 GNP to estimate 1955 inventory stocks
3. Estimation of Inventory Stocks • Acceleration Model Four motives for inventory stocks - Production smoothing, Management efficiency, Stock-out avoidance, Work-in-progress Model (2) (3) The change in GDP () is defined as acceleration referring GDP as speed of production. In other words, inventory investment is viewed as a variable which adjusts as the economy is either accelerating or slowing down. The following equations can be derived to estimate inventory stocks following the acceleration principle.
(4) ) • Suppose that there is a benchmark estimate of inventory stocks, for example, the 1997 National Wealth Survey in Korea. Then the following acceleration model can be specified to estimate inventory stocks after 1997, for example, inventory stock in 2012 () as follows; (5) Mankiw(1994) (6)
3. Estimation of Inventory Stocks Pyo(2005) (1986-2004) (7) This study(2013) (1971-1997) (8) (1971-2012) (9)
3. Estimation of Inventory Stocks Modified Benchmark-Year Estimation As noted by Harberger (1978), there is an intrinsic difficulty in estimating inventory stocks in the sense that it is not reproducible tangible asset and therefore, it has no depreciation. The zero depreciation property and the negative values of inventory investment in certain years make it difficult to apply perpetual inventory method (PIM) to generate inventory stocks. For example, according to Pyo (2005), when the 1987 NWS estimate of inventory stocks was used as the initial value and the inventory investment data on national accounts were kept being added to it cumulatively without applying any depreciation, the generated 1997 estimate of inventory stocks (70,087 billion Won) was only 27.2 percent of the actual survey estimate (257,534 billion Won) by 1997 NWS. Therefore, a pure PIM or a modified PIM which makes use of at least one benchmark estimate seems to break down.
As an alternative model of modified PIM, Pyo (1992) applied the following method. First, the ratio of inventory stock was defined as follows: Inventory-output Ratio = Inventory Stocks in current prices in a benchmark year / Gross output in current prices in preceding year <Assumption> The current level of inventory stocks is mostly affected by the gross output in the preceding year since firms adjust their level of inventory to the level of output in the preceding year not the level of value added because investment includes intermediate inputs and work-in-progress.
In addition the inventory stocks are concentrated in a few industries. For example, the 1997 NWS has the distribution of inventory stocks by industries: Manufacturing (48 %), Retail and Wholesale Trade (25 %), Construction (14 %) and Agriculture Fishery and Forestry (7 %) and all other industries (6 %). Therefore, the inventory-output ratio can be computed for selected industries using inventory stock data from benchmark-year estimates and gross output data from national accounts or Input-Output Tables.
<Table 5> Inventory Stock-Gross output Ratio and Inventory Stock-GDP Ratio in Korea Billion Won, current price, (%) Note : 1) The data of nominal gross output in 1967 is estimated from National Accounts in 1984 2) The rate of Inventory=INVt/Gross outputt-1(or GDPt-1), where t is a benchmark year Sources: Pyo(2005) Table 11 and Table 13
<Figure 4> Estimation of Total Inventory Stock Billion Won, current price Sources: Pyo(2005)
<Figure 5> Estimation of Industrial Inventory Stock using Inventory Stock-Gross output Ratio (1968-2003) Billion Won, current price Sources: Pyo(2005)
<Figure 6> Estimation of Industrial Inventory Stock using Inventory Stock-GDP Ratio(1968-2003) Billion Won, current price Sources: Pyo(2005)
<Figure 7> Comparison of Industrial Inventory Stock using Four Other Estimations Billion Won, 2005 constant price
<Table6> Estimation of Industrial Inventory Stock using Four Other Estimations(1997-2012) Billion Won, 2005 constant price Note Series A: Summation of real investments, Series B: The Acceleration Model Series C: A Modified Benchmark-Year Estimation Method(Inventory-Output Ratio) Series D: A Modified Benchmark-Year Estimation Method(Inventory-GDP Ratio)
4. Conclusion ▪ For the difficulties in imputing the value of land or estimating inventory stocks, EU KLEMS(2007), Asia KLEMS Draft Manual(2012) have not attempted to include land and inventory stocks. ▪ Because of the agrarian nature of Asia economies and rapid transition toward industrialization we have to start thinking about including imputed land and inventory stocks. ▪ Otherwise we may be missing fundamental capital inputs and therefore may end up introducing too much bias in estimating rates of return and total factor productivity.