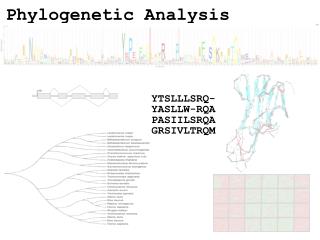
Phylogenetic Analysis
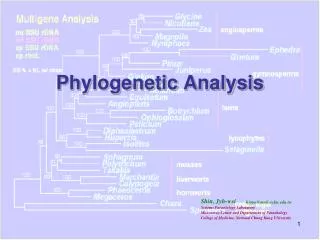
Phylogenetic Analysis. Phylogenetic Analysis Overview. Insight into evolutionary relationships Inferring or estimating these evolutionary relationships shown as branches of a tree Length and nesting reflects degree of similarity between any two items (in our case, sequences).

Phylogenetic Analysis
E N D
Presentation Transcript
Phylogenetic Analysis Overview • Insight into evolutionary relationships • Inferring or estimating these evolutionary relationships shown as branches of a tree • Length and nesting reflects degree of similarity between any two items (in our case, sequences)
Phylogenetics and Cladistics • Clade = a set of descendants from a single ancestor (Greek work for branch) • Three basic assumptions • Any group of organisms are related b descent from a common ancestor • There is a bifurcating pattern of cladogenesis • Change in characteristics occurs in lineages over time
More default assumptions • Correct sequences and origins • Shared ancestral origin • Homologous sequences • No mixtures of nuclear and organellar sequences • Large enough taxa sampling size • Contains representative sequence variations • Sufficient sequence variations
Basic Terminology • Clades: a group of organisms or genes that includes the most recent common ancestor of all of its members and all of the descendants of that most recent common ancestor. • Taxons: any named group of organisms; not necessary a clade. • Branches: branches sometimes correspond to the degree of divergence • Nodes: a bifurcating branch point Branch lengths are not significant Branch lengths are significant
Basic Definition • Homologous: sequences that share an arbitrary threshold level of similarity determined by alignment of matching bases • Similarity: a quantifiable term that refers to a degree of relatedness between sequences, but does not necessarily reflect ancestry. • Orthologs: homologs produced by speciation; derived from a common ancestor; tend to have similar function • Paralogs: homologs produced by gene duplication; derived within an organism, tend to have differing functions • Xenologs: homologs resulting from horizontal gene transfer between two organisms; difficult to verify; variable function but tends to be similar.
Phylogenetic Analysis Overview • Objective: • determine branch length and to figure out how the tree should be drawn • Sequences most closely related drawn as neighboring branches
Phylogenetic Analysis Overview • Dependent upon good multiple sequence alignment programs • Group sequences with similar patterns of substitutions in order to reconstruct a phylogenetic tree
Phylogenetic Analysis Overview • Consider two sequences that are related • Ancestoral sequence can be (partially) derived • With additional sequences, more information can be gathered to add to a correct derivation
Phylogenetic Analysis Overview • Example: C-Terminal Motor Kinesin sequences • http://www.proweb.org/kinesin/BE4_Cterm.html
Practical use of phylogenetic analysis • To prioritize the analysis of genes in the target family – give insight into protein functions
P. asruginosa, a bacteria that is one of the top 3 causes or opportunistic infections, is noted for its antimicrobial resistance and resistance to detergents. • 3 homologous outer membrane proteins, OprJ, OprM and OprN were identified as playing a role in this antimicrobial resistance.
Possible horizontal gene transfer Figure 14.2 Example of a phylogenetic tree based on genes that does not match organismal phylogeny, suggesting horizontal gene transfer has occurred.
Uses of Phylogenetic Analysis • Given a set of genes, determine which genes are likely to have equivalent functions • Follow changes occurring in a rapidly changing species such as a virus • Example: influenza • Study of rapidly changing genes • Next year’s strain can be predicted • Flu vaccination can be developed
Tree of Life • Phylogenies study how the evolution of species has occurred • Image: http://microbialgenome.org/primer/tree.html
Tree of Life • Traditionally, morphological (visible features) characters have been used to classify organisms • Living organisms • Fossil records • Sequence data beginning to take larger role
Tree of Life • Many different resources including: • NCBI taxonomy web sites • University of Arizona’s tree of life project
NCBI Taxonomy Web Site • http://www.ncbi.nlm.nih.gov/Taxonomy/taxonomyhome.html/ 分類法;分類學
Tree of Life • http://tolweb.org/tree/phylogeny.html
Evolutionary Trees • Two dimensional graph showing evolutionary relationship among a set of items • can be organisms, genes, or sequences • Each unit is defined by a distinct branch on the tree
Evolutionary Trees • leaves represent the units (taxa) being studied • nodes and branches representing the relationships among the taxa • Two taxa derived from the same common ancestor will share a node in the graph
Evolutionary Trees • length of each branch may be drawn according to the number of sequence level changes that occurred • distance may not be in direct relation to evolutionary time • uniform rate of mutation analyses use the molecular clock hypothesis
Rooted Trees • One sequence (root) defined to be common ancestor of all of the other sequences • A unique path leads from the root node to any other node • Direction of path indicates evolutionary time • Root chosen as a sequence thought to have branched off earliest
Rooted Trees • If molecular clock hypothesis holds, it is possible to predict a root • As the number of sequences increase, the number of possible rooted trees increases very rapidly • In most cases, a bifurcating binary tree is the best model to simulate evolutionary events
Example Rooted Tree SYSTEMATICS AND MOLECULAR PHYLOGENETICSImage source: http://www.ncbi.nlm.nih.gov/About/primer/phylo.html
Unrooted Tree (Star) • Indicates evolutionary relationship without revealing the location of the oldest ancestry • Fewer possible unrooted trees than a rooted tree
Example Unrooted Tree Image source: http://www.shef.ac.uk/english/language/quantling/images/quantling1.jpg
Methods for Determining Trees • Three main methods: • maximum parsimony • Distance • maximum likelihood
Maximum Parsimony • Predicts evolutionary tree minimizing number of steps required to generate observed variation • Multiple sequence alignment must first be obtained
Maximum Parsimony • For each position, phylogenetic trees requiring the smallest number of evolutionary changes to produce the observed sequence changes are identified • Trees that produce the smallest number of changes for all sequence positions are identified
Maximum Parsimony • Time consuming algorithm • Only works well if the sequences have a strong sequence similarity
Maximum Parsimony Example 1 A AGAG T GCA 2 AGC CG T GCG 3 AGA T A T C CA 4 A GAGA T C CG • four sequences, three possible unrooted trees
3 2 3 1 1 1 2 3 4 4 4 2 Maximum Parsimony Example Possible Trees:
Maximum Parsimony Example • Some sites are informative, and other sites are not • Informative site has the same sequence character in at least two different sequences • Only the informative sites need to be considered
Maximum Parsimony Example 1 A AGAG T GCA 2 AGC CG T GCG 3 AGA T A T C CA 4 A GAGA T C CG Three informative columns
3 3 2 2 3 2 3 3 3 1 1 1 1 1 1 1 1 1 4 3 3 2 3 2 2 4 4 4 2 2 4 4 4 4 4 2 Maximum Parsimony Example 1 GGA 2 GGG 3 AC A 4 AC G Column 1 Column 2 Column 3 Is a substitution
Distance Method • Looks at the number of changes between each pair in a group of sequences • Goal is to identify a tree that positions neighbors correctly and that also has branch lengths which reproduce the original data as closely as possible
Distance Method • CLUSTALW uses the neighbor-joining method as a guide to multiple sequence alignments • PHYLIP suite of programs employ neighbor-joining methods • http://evolution.genetics.washington.edu/phylip.html
Distance Programs in Phylip • NEIGHBOR: estimates phylogenies using either: • neighbor-joining (no molecular clock assumed) • unweighted pair group method with arithmetic mean (UPGMA) (molecular clock assumed)
Distance Analysis • distance score counted as • number of mismatched positions in the alignment • number of sequence positions that must be changed to generate the second sequence • Success depends on degree the distances among a set of sequences can be made additive on a predicted evolutionary tree
Example of Distance Analysis • Consider the alignment: A ACGCGTTGGGCGATGGCAAC B ACGCGTTGGGCGACGGTAAT C ACGCATTGAATGATGATAAT D ACACATTGAGTGATAATAAT
Example of Distance Analysis • Distances can be shown as a table A ACGCGTTGGGCGATGGCAAC B ACGCGTTGGGCGACGGTAAT C ACGCATTGAATGATGATAAT D ACACATTGAGTGATAATAAT
C A 2 1 4 1 2 B D Example of Distance Analysis • Using this information, a tree can be drawn: A ACGCGTTGGGCGATGGCAAC B ACGCGTTGGGCGACGGTAAT C ACGCATTGAATGATGATAAT D ACACATTGAGTGATAATAAT
Fitch and Margoliash Algorithm (3 sequences) • Distance table used • Sequences combined in threes • define the branches of the predicted tree • calculate the branch lengths of the tree
A a C c b B Fitch and Margoliash Algorithm (3 sequences) • 1)Draw unrooted tree with three branches originating from common node:
Fitch and Margoliash Algorithm (3 sequences) 1)Calculate lengths of tree branches algebraically: • distance from A to B = a + b = 22 (1) • distance from A to C = a + c = 39 (2) • distance from B to C = b + c = 41 (3) • subtracting (3) from (2) yields: • b + c = 41 • -a – c = -39 • __________ • b – a = 2 (4) • adding (1) and (4) yields 2b = 24; b = 12 • so a + 12 = 22; a = 10 • 10 + c = 39; c = 29
A 10 C 29 12 B Fitch and Margoliash Algorithm (3 sequences) • 3)Resulting tree:
C A c a f D d b g B e E Fitch and Margoliash Algorithm (5 sequences) • Algorithm can be extended to more sequences. Consider the distances: