J.J. Thomson
J.J. Thomson. Discoverer of the Electron. Background Information. Cathode Rays Form when high voltage is applied across electrodes in a partially evacuated tube. Originate at the cathode (negative electrode) and move to the anode (positive electrode) Carry energy and can do work

J.J. Thomson
E N D
Presentation Transcript
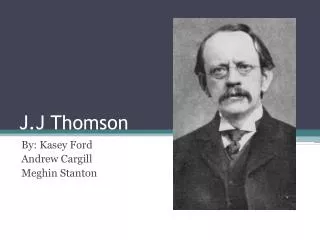
J.J. Thomson Discoverer of the Electron
Background Information Cathode Rays • Form when high voltage is applied across electrodes in a partially evacuated tube. • Originate at the cathode (negative electrode) and move to the anode (positive electrode) • Carry energy and can do work • Travel in straight lines in the absence of an external field
Source of Electrical Potential Stream of negative particles (electrons) Metal Plate Gas-filled glass tube Metal plate A Cathode Ray Tube Zumdahl, Zumdahl, DeCoste, World of Chemistry2002, page 58
Cathode Ray Experiment 1897 Experimentation • Using a cathode ray tube, Thomson was able to deflect cathode rays with an electrical field. • The rays bent towards the positive pole, indicating that they are negatively charged.
High voltage The Effect of an Obstruction on Cathode Rays shadow source of high voltage cathode yellow-green fluorescence Dorin, Demmin, Gabel, Chemistry The Study of Matter , 3rd Edition, 1990, page 117
High voltage negative plate source of high voltage _ cathode anode + positive plate The Effect of an Electric Field on Cathode Rays Dorin, Demmin, Gabel, Chemistry The Study of Matter , 3rd Edition, 1990, page 117
Cathode Ray Experiment - Displacement Volts Anodes / collimators Cathode + Deflection region Drift region
length of deflection region electric field length of drift region charge of ray particle x x x Electric deflection = 2 mass of ray particle velocity of ray particle x length of deflection region magnetic field length of drift region charge of ray particle x x x Magnetic deflection = mass of ray particle velocity of ray particle x magnetic deflection magnetic field = x velocity electric deflection electric field Thomson’s Calculations Cathode Ray Experiment • Thomson used magnetic and electric fields to measure and calculate the ratio of the cathode ray’s mass to its charge.
Conclusions • He compared the value with the mass/ charge ratio for the lightest charged particle. • By comparison, Thomson estimated that the cathode ray particle weighed 1/1000 as much as hydrogen, the lightest atom. • He concluded that atoms do contain subatomic particles - atoms are divisible into smaller particles. • This conclusion contradicted Dalton’s postulate and was not widely accepted by fellow physicists and chemists of his day. • Since any electrode material produces an identical ray, cathode ray particles are present in all types of matter - a universal negatively charged subatomic particle later named the electron
High voltage negative plate sourceof high voltage _ cathode + anode positive plate So what does J.J. Thomson have to do with mass spec? • Just as J.J. Thomson used a magnetic field to affect charged particles, so does a mass spectrometer. • The machine sorts ions according to their mass to charge ratio, something Thomson was able to calculate for the electron using the results of his cathode ray experiments.
What is mass spectrometry? • Mass spectrometry is a technique used to separate a substance into ions based on their mass. • Molecules are bombarded by high energy particles that cause them to lose one electron and carry a +1 charge. These ions undergo further fragmentation producing smaller positive ions. • The spectrum produced plots intensity (abundance of ions) against the ions’ mass-to-charge ratio. • Substances can be identified by their characteristic fragment ions represented on a mass spectrum
Detector plate Ion-accelerating electric field Least massive ions accelerated Ion beam Positive ions Sample Most massive ions Electron beam Magnetic field Slits Heating device to vaporize sample Mass spectrometers that break up molecules into fragments that can be characterized by electrical methods. [image link]
Mass Spectrophotometer magnetic field heaviest ions stream of ions of different masses lightest ions electron beam gas Dorin, Demmin, Gabel, Chemistry The Study of Matter 3rd Edition, page 138
Components of a Mass Spectrometer Inlet Signal processor Detector Source Analyzer Vacuum Inlet- ensures that the sample enters the machine with minimal loss Source - sample components are ionized (the method by which this is done depends on the specific mass spectrometer being used.) Analyzer- accelerates ion and separates them Detector - records the charge induced when an ion passes by or hits a surface. Signal Processor - produces a mass spectrum, a record of the m/z's at which ions are present. *A vacuum must be used to maintain a low pressure. A low pressure reduces the collisions among the ions.
The general operation of a mass spectrometer is: • 1. create gas-phase ions • 2. separate the ions based on their mass-to-charge ratio • 3. measure the quantity of ions of each mass-to-charge ratio Electron Beam Magnetic Field Bends Path of Charged Particles Molecular Source Ion Accelerating Array Collector Exit Slit Ho
198 200 202 196 199 201 204 Mass spectrum of mercury vapor Mass Spectrometry Photographic plate - + Stream of positive ions Hill, Petrucci, General Chemistry An Integrated Approach1999, page 320
Mass Spectrum for Mercury (The photographic record has been converted to a scale of relative number of atoms) The percent natural abundances for mercury isotopes are: Hg-196 0.146% Hg-198 10.02% Hg-199 16.84% Hg-200 23.13% Hg-201 13.22% Hg-202 29.80% Hg-204 6.85% 198 200 202 30 25 20 15 10 5 196 199 201 204 Mass spectrum of mercury vapor Relative number of atoms 196 197 198 199 200 201 202 203 204 Mass number
80 Hg 200.59 The percent natural abundances for mercury isotopes are: Hg-196 0.146% Hg-198 10.02% Hg-199 16.84% Hg-200 23.13% Hg-201 13.22% Hg-202 29.80% Hg-204 6.85% A B C D E F G (% "A")(mass "A") + (% "B")(mass "B") + (% "C")(mass "C") + (% "D")(mass "D") + (% "E")(mass "E") + (% F)(mass F) + (% G)(mass G) = AAM (0.00146)(196) + (0.1002)(198) + (0.1684)(199) + (0.2313)(200) + (0.1322)(201) + (0.2980)(202) + (0.0685)(204) = x 0.28616 + 19.8396 + 33.5116 + 46.2600 + 26.5722 + 60.1960 + 13.974 = x x = 200.63956 amu
17 Cl 35.453 • Assume you have only two atoms of chlorine. • One atom has a mass of 35 amu (Cl-35) • The other atom has a mass of 36 amu (Cl-36) • What is the average mass of these two isotopes? 35.5 amu • Looking at the average atomic mass printed on the periodic table...approximately what percentage is Cl-35 and Cl-36? 55% Cl-35 and 45% Cl-36 is a good approximation
17 Cl 35.453 Using our estimated % abundance data 55% Cl-35 and 45% Cl-36 calculate an average atomic mass for chlorine. Average Atomic Mass = (% abundance of isotope "A")(mass "A") + (% "B")(mass "B") + ... AAM = (% abundance of isotope Cl-35)(mass Cl-35) + (% abundance of Cl-36)(mass Cl-36) AAM = (0.55)(35 amu) + (0.45)(36 amu) AAM = (19.25 amu) + (16.2 amu) AAM = 35.45 amu
What’s mass got to do with it? • An electric or magnetic field can deflect charged particles. • The particles have kinetic energy as they move through a magnetic field (KE=1/2mv2). • The particles’ inertia depends on their mass. • A mass analyzer can steer certain masses to the detector based on their mass-to-charge ratios (m/z). by varying the electrical or magnetic field. • Typically ions in a mass spectrometer carry a +1 charge so the m/z ratio is equivalent to the ion’s mass.
What does a mass spectrum look like? • Intensity or ion abundance is plotted on the y-axis. • The m/z ratio is plotted on the x-axis. • The base beak is from the ion that is the most abundant and is assigned an intensity of 100%. • The molecular ion peak, M+, is the peak due to the parent ion (the original molecule minus one electron).
100 90 80 70 60 % RELATIVE INTENSITY 50 40 30 20 10 0 m/z 30 50 15 20 25 35 40 45 5 10 Mass spectrum of carbon dioxide, CO2 molecular ion is seen at m/z 44. CO2+ M+ O+ CO+ C+ 16 28 12
Mass spectrums reflect the abundance of naturally occurring isotopes. Natural Abundance of Common Elements Hydrogen 1H = 99.985% 2H = 0.015% 12C = 98.90% 13C = 1.10% Carbon Nitrogen 14N = 99.63% 15N = 0.37% 16O = 99.762% 17O = 0.038% 18O = 0.200% Oxygen Sulfur 32S = 95.02% 33S = 0.75% 34S = 4.21% 36S = 0.02% Chlorine 35Cl = 75.77% 37Cl = 24.23% Bromine 79Br = 50.69% 81Br = 49.31%
For example….Methane • For carbon 1 in approximately 90 atoms are carbon-13 • The rest are carbon-12 the isotope that is 98.9% abundant. • So, for approximately 90 methane molecules…1 carbon is carbon-13
C-13 Where’s Waldo?
Why is the Mass Spectrometer an Important Analytical Instrument? Mass Spectrometers have been used in: 1) Forensics 2) Organic synthesis laboratories 3) The analysis of large biomolecules: proteins and nucleic acids 4) Drug Test 5) Determination of isotopic abundance 6) Identification of impurities in pharmaceutical products 7) Diagnosis of certain diseases.
References • http://www.aist.go.jp/RIODB/SDBS/ • http://www.infochembio.ethz.ch/links/en/spectrosc_mass_lehr.html • http://dbhs.wvusd.k12.ca.us/AtomicStructure/Disc-of-Electron-Intro.html • http://wps.prenhall.com/wps/media/objects/340/348272/Instructor_Resources/Chapter_12/47