
Observations of He II Absorption in the IGM: Insights on HI Re-ionization Dynamics
E N D
Presentation Transcript
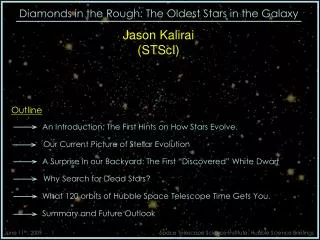
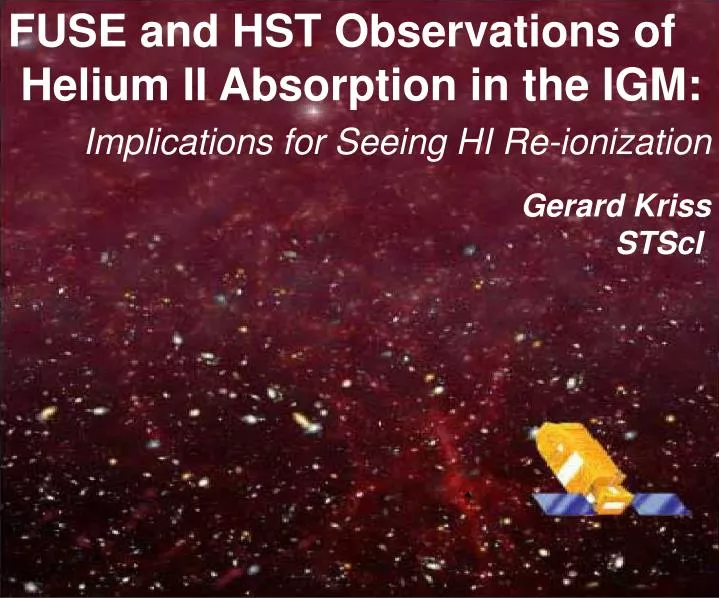
FUSE and HST Observations of Helium II Absorption in the IGM:Implications for Seeing HI Re-ionization Gerard KrissSTScI
What We Can Learn from Observationsof He II Absorption • Use the ratio of He II and H I column densities to ascertain the shape of the ionizing spectrum. • Do stars or quasars dominate the radiation field at z=2-3? • Using the spectral shape in conjunction with proximity-effect measurements of the radiation field intensity, • Set limits on the escape fraction of radiation from star-forming galaxies. • Trace the qualitative appearance of He II reionization. • This may serve as a preview of what H I reionization looks like. • A red damping wing on the G-P trough? • Proximity zone on the blue side of the trough edge? • Red-shifted absorption features indicative of infalling clouds?
Quasars with He II Absorption • Difficult to seeat z~3, only 15% of sightlines are free of LLSs. • There are only 8 known quasars with clear lines of sight:
Indirect Indicators of He II Reionization • Observations of the end stages of He II reionization: HE2347-4342: Reimers et al. (1997), Smette et al. (2002), Zheng et al. (2004a). • Si IV/C IV decreases at z~3: Songaila (1998; 2005). • HI line widths increase IGM temperature increases at z~3.3: Theuns et al. (2002). • HI opacity decreases at z~3.3: Bernardi et al. (2003).
He II Optical Depth vs. Redshift Davidsen et al. 1996 Smette et al. 2002 Zheng et al. 2004a Fechner et al. 2006
The Transition to Complete Reionization Ly Razoumov et al. 2002 Redshift
Indirect Indicators of He II Reionization • Observations of the end stages of He II reionization: HE2347-4342: Reimers et al. (1997), Smette et al. (2002), Zheng et al. (2004a). • Si IV/C IV decreases at z~3: Songaila (1998; 2005). • HI line widths increase IGM temperature increases at z~3.3: Theuns et al. (2002). • HI opacity decreases at z~3.3: Bernardi et al. (2003).
Ionization Evolution of the IGM Songaila 2005 (see also 1998)
Indirect Indicators of He II Reionization • Observations of the end stages of He II reionization: HE2347-4342: Reimers et al. (1997), Smette et al. (2002), Zheng et al. (2004a). • Si IV/C IV decreases at z~3: Songaila (1998; 2005). • HI line widths increase IGM temperature increases at z~3.3: Theuns et al. (2002). • HI opacity decreases at z~3.3: Bernardi et al. (2003).
Thermal History of the IGM Theuns et al. 2002
Indirect Indicators of He II Reionization • Observations of the end stages of He II reionization: HE2347-4342: Reimers et al. (1997), Smette et al. (2002), Zheng et al. (2004a). • Si IV/C IV decreases at z~3: Songaila (1998; 2005). • HI line widths increase IGM temperature increases at z~3.3: Theuns et al. (2002). • HI opacity decreases at z~3.3: Bernardi et al. (2003).
Opacity Evolution of the HI Ly Forest Bernardi et al. 2003
Transparent Windows Extrapolated Continuum IGM Optically Thick In He II Ly IGM Transparent in He II Ly FUSE Spectrum of HE2347-4342 (376 ks) Kriss et al. 2001
FUSE He II Absorption Keck H I Kriss et al. 2001
STIS & FUSE Spectra of HS1700+6416 STIS Spectrum: G140L + G230L Best-fit continuum with E(B-V)=0.025 FUSE Spectrum: 290 ks Fechner et al. 2006
Starlight Quasar Illumination (NHeII/NHI) vs. Redshift (z) Zheng et al. 2004a
Scott et al. 2001 Constraining Fesc for Star-forming Galaxies Bianchi et al. 2001 Scott et al. 2001 Kriss & Scott 2006
He II Absorption in SDSS QSOs z = 3.83 STIS Low-resolution snapshots (G140L), 600 s (Zheng et al. 2004b) z = 3.81 z = 3.49
Simulated He II Lyman Trough “Cosmic voids” produced by local ionizing sources Proximity profile He II Ly forest Red damping wing Gunn-Peterson trough
Conclusions • FUSE observations of HE2347–4342 and HS1700+6416 resolve the He II Ly forest. • He II / H I opacity ratios indicate that AGN contribute more than 50% of the ionizing UV flux at z=2.5. • This implies that the escape fraction for radiation from star-forming galaxies must be less than 5%. • STIS snapshots have identified 3 quasars at redshifts likely to be beyond He II reionization. • Future observations with COS of these quasars may give spectral clues to the qualitative appearance of H I reionization.