GEOGRAPHY HANDBOOK
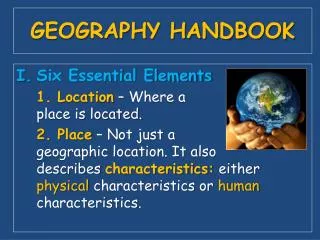
GEOGRAPHY HANDBOOK. Six Essential Elements 1. Location – Where a place is located.

GEOGRAPHY HANDBOOK
E N D
Presentation Transcript
GEOGRAPHY HANDBOOK Six Essential Elements 1. Location – Where a place is located. 2.Place – Not just a geographic location. It also describes characteristics: either physical characteristics or human characteristics.
3. Physical Systems – Geographers study how physical systems (hurricanes, volcanoes and glaciers) shape the earth’s surface.
4. Human Systems – how people have shaped our world. A key them in Geography is the continual movement of people, ideas, and goods.
5. Environment and Society – Geographers study how people use the environment and how their actions affect the environment. 6. Uses of Geography– The knowledge of Geography helps us understand the relationships among people, places and environments.
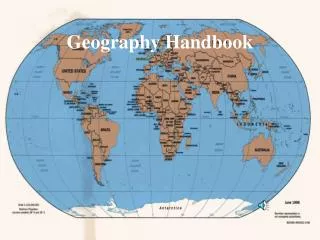
Maps and Globes Hemispheres 1. The earth is divided into two half spheres called hemispheres.
2. The imaginary line that circles the middle of the earth like a belt is called the Equator. 3. Everything north of the Equator is in the Northern Hemisphere. Everything south of the Equator is in the Southern Hemisphere.
4. Another imaginary line that runs from north to south and divides the earth into half spheres in the other direction is called the Prime Meridian. 5. Everything east of the Prime Meridian for 180 degrees is in the Eastern Hemisphere. Everything west of the Prime Meridian for 180 degrees is in the Western Hemisphere.
II. Latitude and Longitude A. Latitude 1. Lines of latitude, or parallels, circle the earth parallel to the Equator. 2. These latitude lines measure the distance north or south of the Equator. 3. The Equator is at 0 degrees latitude, while the North Pole lies at Latitude 90 degrees north.
B. Longitude 1. Lines of longitude, or meridians, circle the earth from Pole to Pole. 2. These lines measure distances east or west of the starting line, which is at 0 degrees and is called the Prime Meridian. 3. The Prime Meridian runs through the Royal Observatory in Greenwich, England.
C. Absolute Location 1. Absolute location is possible to find by the lines of latitude and longitude formed on a grid system. 2. By using degrees ( ° ) and minutes (´) (points between degrees), people can pinpoint the precise spot where one line of latitude crosses on line of longitude – an absolute location.
III. Globes to Maps A. Globe 1. A round scale model of the earth. 2. Most accurate way to show earth by showing continents relative sizes, shapes of landmasses and bodies of water.
B. Map 1. A flat drawing of all or part of the earth’s surface. 2. Can show small areas in great detail. 3. Can display political boundaries, population densities or voting returns.
C. Cartographers 1. Mapmakers use mathematical formulas to transfer information from the round globe to a flat map. 2. Curves of a globe become a straight line on a map and the size shape distance or area can change or be distorted.
D. Mapmaking with Technology 1. Geographic Information System (GIS) Software program which layers map data from satellite images, printed text and statistics.
2. Global Positioning System(GPS) – helps mapmakers and consumers locate places based on coordinates broadcast by satellites.
IV. Common Map Projections A. There are several ways of showing the earth on a flat sheet of paper. These are called projections. B. Goode’s Interrupted Equal-Area - looks like a peeled flattened orange. This projection is helpful to compare land areas among continents.
C. Robinson Projection 1. This has minor distortions and shows land on the western and eastern sides often world much as it appears on a globe.
D. WinkelTripel– gives a good overall view of the continents’ shapes and sizes. E. Mercator – This projection shows true direction and land shapes fairly accurately, but not size or distance.
V. Parts of a Map A. Map Key – explains the lines, symbols, and colors used on a map. B. Scale Bar – a measuring line which helps you figure distance on the map.
C. Compass Rose – A symbol that tells you the cardinal directions – north, south, east, and west.
GROUP WORK: Anticipation Guide Agree Disagree / Agree Disagree 1. A circle graph shows how the whole of something is divided into its parts. 2. Climographs are a combination of a circle graph and a bar graph.
VI. Types of Maps A. General Purpose Map – Maps that show a wide range of general information. 1. Physical Map – show landforms and water features.
2. Political Map – shows the names and boundaries of countries, location of cities and other human-made features of a place, and often identify major physical features.
3. Contour Map – a type of physical map that shows elevation. It has contour lines – one line for each major level of elevation. 4. Special Purpose Map – Shows specific to in detail.
VII. Graphs, Charts, and Diagrams A. Bar and Line Graphs 1. Graphs that use bars or wide lines to compare data visually. 2. Line graph - tool for showing changes over a long period of time.
C. Circle Graph 1. Shows how the whole of something is divided into its parts. D. Charts 1. Present facts and numbers in an organized way. They arrange date, especially numbers, in rows and columns for easy reference.
E. Pictographs 1. Use rows of small pictures or symbols, with each picture or symbol representing an amount.
F. Climographs Combination of a line graph and a bar graph. G. Diagrams Drawings which show steps in a process, point out the parts of an object, or explain how something works. An elevation profile is a type of diagram that can be helpful when comparing the elevations or heights of an area.