Download
1 / 47
470 likes | 666 Vues
Quality of Life Index 2011. Pasadena Public Health Department Eric Walsh MD MPH Director/Health Officer. The Rose That Grew From Concrete.

E N D
Quality of Life Index 2011 Pasadena Public Health Department Eric Walsh MD MPH Director/Health Officer
The Rose That Grew From Concrete Did you hear about the rose that grew from a crack in the concrete? Proving nature's law is wrong it learned to walk with out having feet. Funny it seems, but by keeping it's dreams, it learned to breathe fresh air. Long live the rose that grew from concrete when no one else ever cared.Tupac Shakur
Disparities Gradient Equity DC’d With each mile you travel, life expectancy increases about a year and a half.
Disparities Gradient Equity DC’d The average suburbanite near the Shady Grove station will live 20 years longer than the typical city dweller around Capitol Heights.
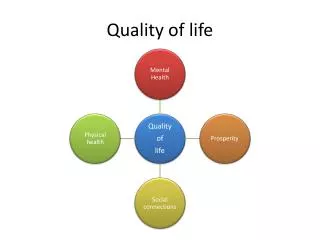
Health Disparities • Health disparities are the inequities in social, economic, and environmental conditions that increase risk of illness and injury, and reduce opportunities for good health.
The short drive to inequity Dahlgren and Whitehead (1991)
What is needed According to Sir Michael Marmot • Social participation • Respect of others • Individual Autonomy • Access to a community • Rewarding relationships These are the things that are missing along the geological gradient
What is the Quality of Life Index? • The Quality of Life Index was first produced in 1992, with an update of the data in 1998. Last completed in 2002. • The audience for the Index is mainly professional, used most often for grant writing, and, to a lesser extent, as an aid to policy development. • The index is a gauge to look at social determinants of health in the local area. • The index covers Pasadena (and Altadena as much as possible). 10
Estimated Household Income Levelsof Pasadena and Altadena Combined (2005) Source: United Way Zip Code Data Book
Living Wage • There is a wide range of income levels in Pasadena and Altadena. • According to updated data, approximately 54% of households earned a combined salary of more than $50,000. • The Median household income 2005-2009 $62,242, compared to $60,392 (CA) & 26,983 (Los Angeles County). • Living wage status affects all members of a household. • The National Health Interview Survey of 2009 reported that about 65% of children in non-impoverished families were in excellent health, compared with only 44% of children in poor families. • Children in poor and near-poor families were more likely to be uninsured, have unmet medical needs, and have delayed medical care. • Approximately 55% of the students in the Pasadena Unified School District live in households that are below the federal poverty guideline thresholds.
Unemployment Rates for 1990-2011 *Preliminary Data ^Not seasonally adjusted Source: Employment Development Department & US Bureau of Labor & Statistics 14
Housing Affordability: Average Housing Prices in Pasadena and Altadena Source: California Association of Realtors 16
Homeless Adults by Ethnicity (2010) Source: Pasadena 2010 Homeless County Preliminary Report 18
Homelessness • The City of Pasadena, like many large cities, has a substantial number of households that are at risk for homelessness. • According to the U.S. Census Bureau, in 2000, there were approximately 30,000 residents (nearly one of every four residents) who were members of a household whose income was $15,000 a year or less. Of these households, approximately half (15,000 residents) were members of a household whose income was less than $10,000. • These data indicate that there is a continued need to ensure programs like the Shelter Plus Care Program, the HOME Investment Project, and Pasadena’s Mortgage Credit Certificate (MCC) Program remain. 19
PUSD Ethnic Diversity English Language Learning Students (students for whom English is not their first language) account for 21% of PUSD students, or a little more than one in five students. Source: California Department of Education 21
Average SAT I score of PUSD Of the 1,120 graduates in 2009, 446 (39.8%) students met course requirements for the University of California/California State University application process. This is higher than both the County and State average, 32.6% and 33.9%, respectively. Source: California Department of Education 22
Public Education • The Pasadena Education Foundation (PEF) which in 2009-2010 raised more than $4.22 million from private and corporate donors (and $6.9 million in governmental grants), with 2,520 donors in all. • Pasadena LEARNs serves more than 3,000 students daily at 22 elementary, middle and high school campuses in PUSD.
Voter Participation Rates for the November 2004, 2006, 2008, and 2010 General Elections
Incidence of Crime in Pasadena 31 Source: Pasadena Police Department
Annual Number of Days that Pollutant Levels Exceed the Government Standards in Pasadena* ^ * There was unavailable/insufficient data for the PM2.5 levels for the City of Pasadena in 2010 Source: California Air Resources Board 33
Hospital Use in Pasadena (Huntington Emergency Department) 35 Source: MIS
Low Cost Clinic Use in Pasadena Sources: MIS 36
Percent Distribution of Births by Race/Ethnicity by Jurisdiction ^National Center For Health Statistics, Final Natality Data, Retrieved November 23, 2011, From Www.Marchofdimes.Com/Peristats. March Of Dimes Breakdown Of Ethnicity. Average For Years 2006-2008 †,‡ Table 2-33. Live Births By Race/Ethnic Group1 Of Mother, California Counties And Selected City Health Departments, 2009 (By Place Of Residence). Other Ethnicity Includes ‘2 Or More Race Groups’, ‘American Indian’, ‘Pacific Islander’, ‘Other’ and ‘Unknown’.
Infant Mortality Percent of Live Birthsby Jurisdiction 2005-2007 *Total Pasadena births (2005-2007) is 6651. Total infant mortalities totaled 34. Source: State of California, Department of Health Services, Birth Records 2005-2007 Pasadena Public Health Department
Percent of Students who have ever Used Alcohol, Tobacco, or Drugs (Grade 5) (2009-2010) 43 Source: California Healthy Kids Survey
Percent of Students who used Alcohol and Other Drugs at least once in their life- 2009-2010 44 Source: California Healthy Kids Survey
Number of New and Cumulative Cases of HIV/AIDS in Pasadena 45 Source: California Department of Public Health, Office of Aids
Ten Leading Causes of Death in California in 2008 46 Source: State of California and Los Angeles County Department of Health Services, Death Records
What are the next steps? If you have any questions or concerns, please contact Dr. Eric Walsh at ewalsh@cityofpasadena.net or (626) 744-6166. To receive an electronic copy, please email Erika Davies (edavies@cityofpasadena.net). 47