Download
1 / 17
190 likes | 453 Vues
Quality of Life. Presented by: Jane Allender, Stacy Wozny, Ryan Villiard Mt. Mourne School, an IBO World School. Quality of Life. Unit Question: What do you really need? Area of Interaction: Health & Social Education

E N D
Quality of Life Presented by: Jane Allender, Stacy Wozny, Ryan Villiard Mt. Mourne School, an IBO World School
Quality of Life • Unit Question: What do you really need? • Area of Interaction: Health & Social Education • To help students see how different choices play in their quality of life and well-being • To help students see lifestyle implications of making choices • Significant Concept(s): • Understand what determines quality of life • Necessities for quality of life change over time
Critical Thinking Questions • What determines quality of life? • How is quality of life measured? • How does the concept of what is necessary for a high quality of life change over the course of our lives? Adapted from Facing the Future Real World Math Engaging Students through Global Issues, 2009.
Take a step forward if you agree… • People who have many friends have a good life. • People who make more than enough money to pay their monthly bills have a good life. • People who graduate from college have a good life. Adapted from Facing the Future Real World Math Engaging Students through Global Issues, 2009.
If everyone in the world was “living the good life”, what would we have in common? Adapted from Facing the Future Real World Math Engaging Students through Global Issues, 2009.
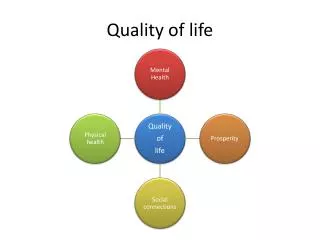
Quality of Life: Data Collection • After the class discussion about characteristics of a “good life”, teacher leads students to categorize their thoughts and ideas. • Each group of students is given one of the following categories: Family, Friends, Health, Relaxation, Recreation, Creative Pursuits, Spiritual Pursuits, Work/Earn Money, Volunteer/Help Others, and Environment. • Teacher leads a discussion with students about the meaning/relevance of each category and then students choose a measureable indicator to develop a survey question.
Quality of Life: Data Collection • The class uses the survey questions that they developed to collect data from both students and adults. • Students bring results to class and data is compiled and analyzed.
Quality of Life: Global Perspective The average number of hours worked by people in the United States per year increased from about 33 hours per week in 1979 to about 34.5 hours per week in 2011.Why do you think people work more hours now than they did 20 years ago? How might an increase in working hours affect quality of life?
http://www.billshrink.com/blog/4724/working-around-the-world/http://www.billshrink.com/blog/4724/working-around-the-world/
Working Around the World • Students use 2003 and 2008 data of work hours from different countries • Students make a double box plot • Students make inferences about the data Common Core Standards: 6.SP.4, 7.SP.1, 7.SP.2, 7.SP.3, 7.SP.4, S-ID.1, S-ID.2
Working Around the World 2003 data 2008 data Scale of 1000 – 2000 hours, intervals of 50 Make at least two inferences about the data shown.
What do you really need? • Students were given three sets of data • Percentage stating “very happy” from www.nationmaster.com • Happy Planet Index (HPI) www.nationmaster.com • Gross Domestic Product Ranking (GDP) www.nationmaster.com • Students created scatter plots using the data • Students analyzed the data by determining the correlations (associations). Common Core Standards: 8.SP.1, 8.SP.2, S-ID.6
What do you really need? • In groups of 4, using the data provided, create a scatter plot of your assigned data. • As a group, write one statement describing the pattern of association (correlation) between the two quantities. • Make one inference about quality of life using your data.
Hungry Planet: What The World Eats • Students view slideshow and collect data. • Students create a box plot of the data and make inferences. • How does how much money each country spends on food compare to their happy planet index? • Reference book Common Core Standards: 6.SP.4, 7.SP.1, 7.SP.2, 7.SP.3, 7.SP.4, S-ID.1, S-ID.2
Quality of Life Assessment • How does the concept of what is necessary for a high quality of life change over the course of our lives? • How is your perspective of what you really need change over the course of this unit?
Web Resources • http://www.time.com/time/photogallery/0,29307,1645016,00.html • http://www.oecdbetterlifeindex.org/topics/work-life-balance/ • http://247wallst.com/2012/07/18/countries-where-people-work-least/ • http://www.oecd.org/document/0,3746,en_2649_201185_46462759_1_1_1_1,00.html • http://www.billshrink.com/blog/4724/working-around-the-world/ • http://www.happyplanetindex.org/
Presenter Email Addresses • Jane Allender: jallender@iss.k12.nc.us • Stacy Wozny: swozny@iss.k12.nc.us • Ryan Villiard: ryan_villiard@iss.k12.nc.us