Quality of Life
160 likes | 356 Vues
Quality of Life. Patient’s evaluation of quality of life. Provides understanding of impact of illness from patient’s viewpoint Different from health status or physical functioning Quality of life can be good even with physical disability

Quality of Life
E N D
Presentation Transcript
Patient’s evaluation of quality of life • Provides understanding of impact of illness from patient’s viewpoint • Different from health status or physical functioning • Quality of life can be good even with physical disability • More than health problems, loss of abilities, or functional deficits • Incorporation of patient’s values sets QOL assessment apart from measures of health status
Patient’s evaluation of quality of life • Important tool for understanding individual differences in response to illness • Individual responses in adapting to cancer and treatment • Re-evaluation of life in context of life-threatening disease • Ultimate purpose for QOL assessment Enhanced well-being • Particularly in palliative care and at end of life (interventions aimed at providing comfort and emotional support) • Maximize QOL
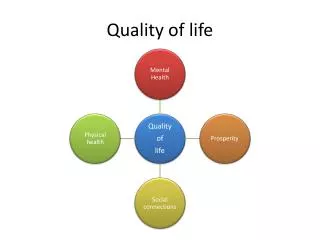
Ferrans Model of QOL (1985 & 1990) Scope of the Concept Health andFunctioning Domain Social and Economic Domain Quality of Life Psychological/Spiritual Domain Family Domain
Ferrans & PowersQuality of Life Index Part 1: SATISFACTIONwith various aspects of life Part 2: IMPORTANCEof those same aspects of life • Scores reflect satisfaction with the aspects of life that are valued by the individual. • Five Scores • Overall QOL • Health and functioning • Psychological/spiritual • Social and economic • Family
Ferrans & PowersQuality of Life Index • Published first in 1985 (200+ published studies) • International research (30+ countries) • Americas:USA, Canada, Mexico, Brazil, Chile • Europe:Denmark, France, Great Britain, Hungarian, Italy, Lithuania, Norway, Poland, Portugal, Romania, Russia, Spain, Sweden • Middle East:Israel, Jordan, Turkey • Africa:South Africa • Asia:India, China, Korea, Japan, Thailand, Taiwan • Australia and New Zealand • U.S. cross-cultural research • African Americans • Mexican Americans • Korean Americans
Arabic Chinese Danish English French Hebrew Hungarian Italian Japanese Korean Lithuanian Norwegian Polish Portuguese Romanian Russian Spanish Swedish Tamil Thai Turkish 21 Languages
Ferrans & Powers Quality of Life Index -- Prognostic value in 251 breast cancer patients (p = .0006)
Quality of Life of African American Cancer SurvivorsNIH R01 CA89418 (CALGB 119901) • Survivors: 500 African American cancer survivors • Breast, prostate, colon • Currently free of cancer • Controls: 500 African American non-cancer controls • Selected via random digit dialing from the areas in which the cancer survivors reside. • Matched (as a group) to the survivor group on age, gender, health insurance status, and education level
Heme/Onc Associates of Central NY Northern Indiana Ohio State University University of Chicago University of Illinois at Chicago Wake Forest Walter Reed Washington University – St. Louis Hartford Hospital Jersey Shore Medical Center Navy Medical Center – San Diego Queens Hospital Medical Center Roswell Park Cancer Center Sibley Memorial Hospital Wayne Memorial Hospital - SCCC Jesse Brown VA Medical Center 16 Participating CALGB Institutions
Explaining the Variance in Quality of Life .4% 2% .2% 3% 5% 5% 26% 8% 9% 22% 19% Model explained 66% of variance in QOL