Download
1 / 2
Comparative Analysis of Cell Signaling in Metastatic Prostate Cancer Sublines
20 likes | 132 Vues
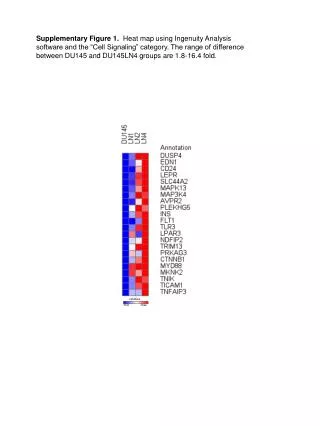
A heat map using Ingenuity Analysis Software reveals a 1.8-16.4 fold difference in cell signaling between DU145 and DU145LN4 groups in the "Cell Signaling" category. Supplementary Table 1 shows relative expression levels of PLAU, EPCAM, ITGB4, and housekeeping genes in the metastatic DU145-LN sublines.
Télécharger la présentation 
Comparative Analysis of Cell Signaling in Metastatic Prostate Cancer Sublines
An Image/Link below is provided (as is) to download presentation
Download Policy: Content on the Website is provided to you AS IS for your information and personal use and may not be sold / licensed / shared on other websites without getting consent from its author.
Content is provided to you AS IS for your information and personal use only.
Download presentation by click this link.
While downloading, if for some reason you are not able to download a presentation, the publisher may have deleted the file from their server.
During download, if you can't get a presentation, the file might be deleted by the publisher.
E N D
Presentation Transcript
Supplementary Figure 1. Heat map using Ingenuity Analysis software and the “Cell Signaling” category. The range of difference between DU145 and DU145LN4 groups are 1.8-16.4 fold. relative min max
Supplementary Table 1. Relative expression levels of PLAU, EPCAM, ITGB4 and housekeeping genes in the metastatic DU145-LN sublines.


More Related