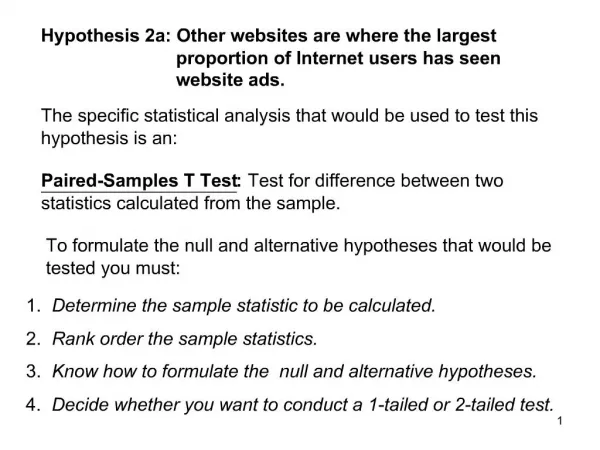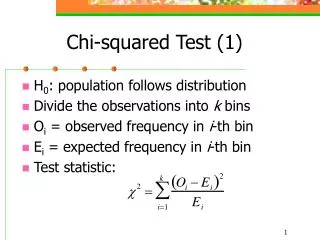
Test statistic: Group Comparison
Learn about hypothesis testing, sample t-tests, computation methods, SPSS analysis, nonparametric tests, and more for group comparisons in statistics research.

Test statistic: Group Comparison
E N D
Presentation Transcript
Research Statistics, Lecture 5 Test statistic: Group Comparison Jobayer Hossain Larry Holmes, Jr October 30,2008
One group sample - one sample t-test • Test for value of a single mean • E.g., test to see if mean SBP of all AIDHC employees is 120 mm Hg • Assumptions • Parent population is normal • Sample observations (subjects) are independent
One group sample- one samplet-test • Formula Let x1, x2, ….xn be a random sample from a normal population with mean µ and variance σ2, then the following statistic is distributed as Student’s t with (n-1) degrees of freedom.
One group sample- one sample t-test • Computation in Excel: • Excel does not have a 1-sample test, but we can fool it. • Suppose we want to test if the mean height of pediatric patients in our data set 1 is 50 inch • Create a dummy column parallel to the hgt column with an equal number of cells, all set to 0.0 • Run the Matched sample test using hgt and the dummy column and 50 as the hypothesized mean difference. • The p-value for two tail test is 0.0092
One group sample - one sample t-test • Using SPSS: • Analyze> Compare Means >One Sample T Test > Select variable (e.g. height) > Test value: (e.g. 50) > ok • P-value is .009 • Interpretation: The mean height of the pediatric patients in our dataset 1 is statistically significantly different from 50 inches.
One group sample - Sign Test (Nonparametric) • Use: (1) Compares the median of a single group with a specified value (instead of single sample t-test). • Hypothesis:H0:Median = c Ha:Median c • Test Statistic: We take the difference of observations from median (xi - c). The number of positive difference follows a Binomial distribution. For large sample size, this distribution follows normal distribution.
One group sample - Sign Test (Nonparametric) • SPSS: Analyze> Nonparametric Tests> Binomial
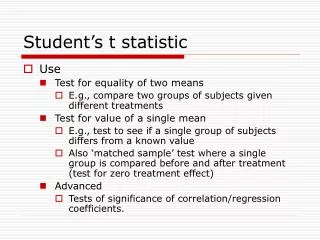
Two-group (independent) samples - two-sample t-statistic • Use • Test for equality of two means • Assumptions • Parent population is normal • Sample observations (subjects) are independent.
Two-group (independent) samples - two-sample t-statistic • Formula (two groups) • Case 1: Equal Population Standard Deviations: • The following statistic is distributed as t distribution with (n1+n2 -2) d.f. The pooled standard deviation, n1 and n2 are the sample sizes and S1 and S2 are the sample standard deviations of two groups.
Two-group (independent) samples - two-sample t-statistic • Formula (two groups) • Case 2: Unequal population standard deviations • The following statistic follows t distribution. • The d.f. of this statistic is,
Two-group (independent) samples - two-sample t-statistic • MS Excel (in Tools -> Data Analysis…) • Two Groups (Independent Samples): • t-Test: Two-Sample Assuming Equal Variances • t-Test: Two-Sample Assuming Unequal Variances
Two-group (independent) samples - two-sample t-statistic • Using SPSS: • Analyze>Compare Means>Independent-Samples T-test> • Select hgt as a Test Variable • Select sex as a Grouping Variable • In Define Groups, type f for Group 1 and m for Group 2 • Click Continue then OK • It gives us the p-value 0.205. We can assume equal variance as the p-value of F statistic for testing equality of variances is 0.845.
Two-group (independent) samples- Wilcoxon Rank-Sum Test (Nonparametric) • Use: Compares medians of two independent groups. • Corresponds to t-Test for 2 Independent Means • Test Statistic: Let, X and Y be two samples of sizes m and n. Suppose N=m+n. Compute the rank of all N observations. Then, the statistic, Wm= Sum of the ranks of all observations of variable X.
Two-group (independent) samples- Wilcoxon Rank-Sum Test (Nonparametric) Asthmatic score A Asthmatic score B Score Rank Score Rank 71 1 85 5 82 3 3.5 82 4 3.5 77 2 94 8 92 7 97 9 88 6 ... ... Rank Sum 19.5 25.5
Two-group (independent) samples- Wilcoxon Rank-Sum Test (Nonparametric) • SPSS: • Two Groups: Analyze> Nonparametric Tests> 2 Independent Samples
Two-group (matched) samples - paired t-statistic • Use: Compares equality of means of two matched or paired samples (e.g. pretest versus posttest) • Assumptions: • Parent population is normal • Sample observations (subjects) are independent
Two-group (matched) samples - paired t-statistic • Formula • The following statistic follows t distribution with n-1 d.f. Where, d is the difference of two matched samples and Sdis the standard deviation of the variable d.
More on test statistic • One-sided • There can only be on direction of effect • The investigator is only interested in one direction of effect. • Greater power to detect difference in expected direction • Two-sided • Difference could go in either direction • More conservative
Two-group (matched) samples Wilcoxon Signed-Rank Test (Nonparametric) • USE: • Compares medians of two paired samples. • Test Statistic • Obtain Difference Scores, Di= X1i- X2i • Take Absolute Value of Differences, Di • Assign Ranks to absolute values (lower to higher), Ri • Sum up ranks for positive differences (T+) and negative differences (T-) • Test Statistic is smaller of T- or T+ (2-tailed)
Example of Wilcoxon signed rank test (two matched samples) 3rd & 4th ranks are tied hence averaged. P-value of this test is 0.02. Hence the test is significant at any level more than 2%, indicating the drug is more effective than placebo.
Two-group (matched) samples Wilcoxon Signed-Rank Test (Nonparametric) • SPSS: • Two Matched Groups: Analyze> Nonparametric Tests> 2 Related Samples
Comparing > 2 independent samples: F statistic (Parametric) • Use: • Compares means of more than two groups • Testing the equality of population variances.
Comparing > 2 independent samples: F statistic (Parametric) • Let X and Y be two independent Chi-square variables with n1 and n2 d.f. respectively, then the following statistic follows a F distribution with n1 and n2 d.f. • Let, X and Y are two independent normal variables with sample sizes n1 and n2. Then the following statistic follows a F distribution with n1 and n2 d.f. Where, sx2 and sy2 are sample variances of X and Y.
Comparing > 2 independent samples: F statistic (Parametric) • Hypotheses: H0: µ1= µ2=…. =µn Ha: µ1≠ µ2 ≠ …. ≠µn • Comparison will be done using analysis of variance (ANOVA) technique. • ANOVA uses F statistic for this comparison. • The ANOVA technique will be covered in another class session.
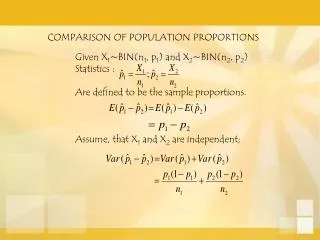
Proportion Tests • Use • Test for equality of two Proportions • E.g. proportions of subjects in two treatment groups who benefited from treatment. • Test for the value of a single proportion • E.g., to test if the proportion of smokers in a population is some specified value (less than 1)
Proportion Tests • Formula • One Group: • Two Groups:
Proportion Test • SPSS: • One Group: Analyze> Nonparametric Tests> Binomial • Two Groups?
Proportion of males in Dataset 1 • SPSS: • recode sex as numeric - • Transform> Recode>Into Different Variables> Make all selections there and click on Change after recoding character variable into numeric. • Analyze> Nonparametric test> Binomial> select Test variable> Test proportion • Set null hypothesis = 0.5 • The p-value = 1.0
Chi-square statistic • USE • Testing the population variance σ2= σ02. • Testing the goodness of fit. • Testing the independence/ association of attributes • Assumptions • Sample observations should be independent. • Cell frequencies should be >= 5. • Total observed and expected frequencies are equal
Chi-square statistic • Formula: If xi (i=1,2,…n) are independent and normally distributed with mean µ and standard deviation σ, then, • If we don’t know µ, then we estimate it using a sample mean and then,
Chi-square statistic • For a contingency table we use the following chi- square test statistic,
Chi-square statistic – calculation of expected frequency • To obtain the expected frequency for any cell, use: • Corresponding row total X column total / grand total • E.g: cell for group 1 and female, substituting: 30 X 20 / 60 = 10
Chi-square statistic • SPSS: • Analyze> Descriptive stat> Crosstabs> statistics> Chi-square • Select variables. • Click on Cell button to select items you want in cells, rows, and columns.
Credits • Thanks are due to all whose works have been consulted prior to the preparation of these slides.