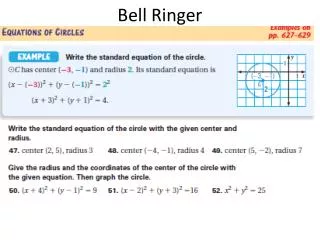
Analyzing Motion through Distance-Time Graphs
In this lesson, students learn to interpret distance-time graphs to describe an object's motion, such as a tumble buggy. Teams will discuss how to represent motion graphically and identify the relevant variables that may change in their descriptions. Students will create distance-time graphs using real data collected during a lab activity, where they measure the distance and time as the buggy travels. They will learn to draw the best-fit line, determine the slope, and understand different types of motion characteristics represented by the graph.


Analyzing Motion through Distance-Time Graphs
E N D
Presentation Transcript
Bell Ringer 25 June 2009
LT: Interpret a distance-time graph to properly describe the motion of an object. • Discuss with your team how the motion of an object can be described with a graph.
Describe tumble buggy motion • Define the system - What must we include; what may we disregard? • Define the variables - What aspects are likely to change in our description of the motion?
Making a distance-time graph • Start your stopwatch when car passes the starting line. • Every 5 seconds place a washer beside the tumble buggy’s position (distance measured from the starting line). • Record distance and time, and make a d-t graph.
Best-fit Line for Tumble Buggy Correct Fit Minimize Residuals • Determine expected model of best-fit line (e.g., proportional, linear, inverse). • Determine if line must pass through origin. • Fit line so that it minimizes the sum of all vertical deviations (residuals) from that line.
Interpreting Slopes • To find slope, identify two points on best-fit line. • Identify one point’s coordinates as (xP, yP) and the other point’s coordi-nates as (xR, yR). • Calculate slope = change in y divided by change in x. • Slopes can be + (a and b), - (c and d), 0 (horizontal), or infinite (vertical).