Download
1 / 19
190 likes | 218 Vues
The Sine and Cosine Functions and Their Graphs. Define the sine and cosine functions for any angle Define the sine and cosine functions for any real number by using the unit circle and wrapping function Represent the sine and cosine functions Use the sine and cosine functions in applications

E N D
The Sine and Cosine Functions and Their Graphs Define the sine and cosine functions for any angle Define the sine and cosine functions for any real number by using the unit circle and wrapping function Represent the sine and cosine functions Use the sine and cosine functions in applications Model with the sine function (optional) 6.3
Teaching Example 1 Suppose a robotic hand is located at the point(−11, 60), where all units are in inches. (a) Find the length of the arm. (b) Let and represent the angle between the positive x-axis and the robotic arm. Find (c) Let and represent the angle between the positive x-axis and the robotic arm. Find How do the values for compare with the values for
Teaching Example 1 (continued) Solution (a) The length of the arm is
Teaching Example 1 (continued) Since the values of x, y, and r do not change, the trigonometric values for are the same as those for (b) (c)
Teaching Example 2 Find sin 150° and cos 150°. Support your answer using a calculator. Solution
Teaching Example 2 Verify the result with a graphing calculator in degree mode.
Teaching Example 3 Find the exact values of The terminal side falls in quadrant IV.
Teaching Example 4 (a) Find the grade of the road. (b) Determine the grade resistance for a 6000-pound pickup truck. Interpret the result. A downhill graph is modeled by the line y = −0.04x in the fourth quadrant. Solution (a) The slope of the line is −0.04, so when xincreases by 100 feet, ydecreases by 4 feet. The grade is −4%.
Teaching Example 4 (continued) (b) The grade resistance is given by R = W sin θ, where W = the weight of the vehicle. The point (100, −4) lies on the terminal side of θ, so
Teaching Example 4 (continued) This means that gravity pulls a 6000-pound vehicle downhill with a force of about 240 pounds.
Teaching Example 5 Use a calculator to approximate sin 2.15 and cos 2.15. Solution
Teaching Example 6 Find sin theta and cos theta if the terminal side of theta intersects the unit circle at Solution The terminal side of angle theta intersects the unit circle at the point Because this point is in the form of it follows that
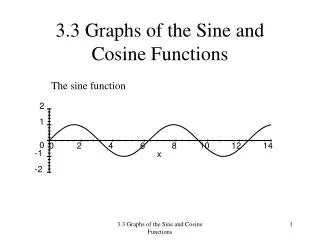
Teaching Example 7 • Let’s make a graph of f(t) = sin(t) for -2π≤ t ≤ 2π. First let’s create a list of values to include. • Repeat for f(t) = cos(t) over the same interval.
Teaching Example 8 The phases of the moon are periodic and have a period of 2π. The phases can be modeled by the function Find all phase angles θ that correspond to a full moon and all phase angles that correspond to a new moon. Assume that can be any angle measured in radians. Full Moon: peak New Moon: valley
(a) Find the range of I. (b) Evaluate and interpret the result. (a) Since the range of cos t is [−1, 1], the range of is [−10, 10]. Teaching Example 9 The amperage I in an electrical circuit after t seconds is modeled by Solution
Teaching Example 9(continued) This means that the amperage is 10 amps after (b)
Teaching Example 10 The table lists the luminescence y of a plant after t hours, where t = 0 corresponds to midnight. (a) Graph the data and the functionL(t) = 4 cos (0.27t) + 6. How well does the function model the data. (b) Estimate the luminescence when t = 15. (c) Use the midpoint formula to complete part (b). Are your answers the same? Why?
Teaching Example 10(continued) (b) Solution (a)
Teaching Example 10 (continued) (c) Using the midpoint formula, we have The answers are not the same because the midpoint method is a linear approximation, whereas the cosine function is non-linear.