Download
1 / 21
210 likes | 330 Vues
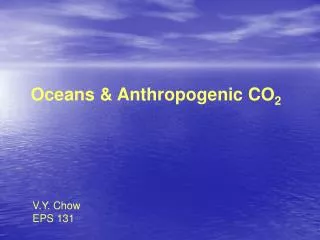
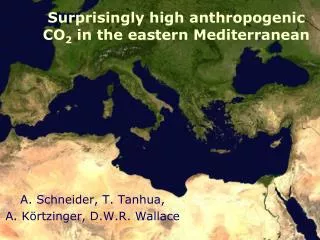
Surprisingly high anthropogenic CO 2 in the eastern Mediterranean. A. Schneider, T. Tanhua, A. Körtzinger, D.W.R. Wallace. Thermohaline circulation. Meteor 51/2 in 2001. Salinity, Temperature, Oxygen Dissolved inorganic carbon Total alkalinity CFC-12. Thyrranian Sea.

E N D
Surprisingly high anthropogenic CO2 in the eastern Mediterranean A. Schneider, T. Tanhua, A. Körtzinger, D.W.R. Wallace
Meteor 51/2 in 2001 • Salinity, Temperature, Oxygen • Dissolved inorganic carbon • Total alkalinity • CFC-12 Thyrranian Sea
Transit time distribution (TTD) CFC-12 concentrations • TTD with a mean age Atmospheric history of CO2 + TTD • Anthropogenic carbon (Cant) Mean age
Total Cant Inventories Mediterranean Sea compared to World Ocean: • 0.3 % of the water volume • 1.1 % of the Cant
Hypothesis Why is the uptake higher? • Low Revelle Factor (9-10) • Deep water formation
Conclusions • CFC-12 and Cant have penetrated the entire water column • High Cant inventories • Deep water formation areas are of great importance • Influence on the global ocean • Measurements in the marginal seas are needed
Flux calculations • Good agreement with Huertas et al. 2009 using the ΔC* method: +4.2 Tg C yr-1 • Aït-Ameur & Goyet using the TrOCA method: opposite flux
Cant Column Inventories from Waugh et al. 2006
Age2 Age3 Age1 Transit time distribution (TTD) Age2 Age3 Age1
Transit time distribution (TTD) • CFC-12 concentrations • atmospheric history • assumptions for saturation and mixing
Transit time distribution (TTD) Mean age
Transit time distribution (TTD) You get: Anthropogenic Carbon (Cant) 120 110 100 90 Anthropogenic CO2 [ppm] 80 70 60 50
Mean age = 30 yrs Width = 45 Width = 0.1 Width = 30 Width = 1 Width = 10
Width = 30 Mean age = 30 Width = 15 Mean age = 30