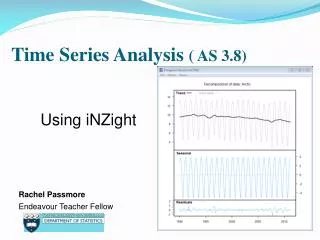
Download
1 / 22
220 likes | 317 Vues
Explore the challenge of analyzing evolving landscapes amid changing territorial divisions using innovative grid-based solutions. Learn about methodologies for combining data from different geometries effectively. Includes a case study on population growth rates in South-Western France from 1990 to 2006. Examine approaches for balancing spatial resolution and noise levels in data analysis. Discover strategies to enhance signal clarity while minimizing noise interference. Enhance your understanding of time series analysis with grid-based techniques and their implications for future research.

E N D
GRIDS AS USEFUL TOOLFOR REBUILDING TIME SERIES Claude GRASLAND (Univ. Paris Diderot) Nicolas LAMBERT (CNRS-RIATE) Hélène MATHIAN (CNRS- Géographie-cités)
SPECIFIC PROBLEM HOW IS IT POSSIBLE TO ANALYZE EVOLUTIONS WHEN TERRITORIAL DIVISIONS ARE CHANGING ?
GENERAL PROBLEM GEOM1 GEOM1 x GEOM2 GEOM2 HOW IS IT POSSIBLE TO COMBINE DATA AVAILABLE ON TWO DIFFERENT GEOMETRIES ?
SOLUTION n°1 : TRANSFER DATA BY GRID SOLUTION V1_GRID GEOM1xV1 Auxilliary attribute GRID GEOM2xV2
SOLUTION n°2 : GRIDDING + SMOOTHING V1_GRID GEOM1xV1 POT_V1 Ancillary variable GRID POT_V2 / POT_V1 V2_GRID GEOM2xV2 POT_V2
OBJECTIVE : Annual growth rate of population 1990-2006 GEOM1 55 Arrondissements GEOM2 52 Zones d’emploi ??? ???
AN EXACT BUT NOT INTERESTING SOLUTION : Aggregation at first common level
Grid of population 1km x 1km From EEA ANCILLARY VARIABLE 100 000 Grid points
ESTIMATION OF TARGET INDICATOR POP90 / ARRD POP90 /GRID POT (POP90) Gauss 20 km POP00/GRID ANNUAL GROWTH RATE 1990-2006 Gauss 20 km POP06 / ZEMP POP06/ GRID POT (POP06) Gauss 20 km
ESTIMATION OF RESIDUAL « NOISE » POP06 / ARRD POP06/GRID* POT (POP06)* Gauss 20 km POP00/GRID POT(POP06) * ____________ POT (POPO6) POP06 / ZEMP POP06/GRID POT (POP06) Gauss 20 km
Smooth 10 km GOOD SPATIAL RESOLUTION … … BUT HIGH LEVEL OF NOISE Increase of population 1990 - 2006 Noise introduced by the method (%) 0 0.25 0.5 0.75 1.0 -5% -1% +1% +5%
Smooth 40 km LOW SPATIAL RESOLUTION … … BUT LOW LEVEL OF NOISE Increase of population 1990 - 2006 Noise introduced by the method (%) 0 0.25 0.5 0.75 1.0 -5% -1% +1% +5%
Smooth 20 km GOOD COMPROMISE BETWEEN SPATIAL RESOLUTION AND NOISE Increase of population 1990 - 2006 Noise introduced by the method (%) 0 0.25 0.5 0.75 1.0 -5% -1% +1% +5%
SYNTHESIS : Signal & Noise Max Noise < 5% Mean Noise < 1% Gaussian Smooth > 22 km
Smooth + Grid CONCLUSION & PERSPECTIVES
Thank you for your attention ! Grasland, Mathian, Vincent, 2000, Statistical Journal of UN-ECE Grasland, Madelin, 2007, ESPON 3.4.3, MAUP