Statistical Process Control Using ColorMetrix (.mdb) and Minitab for Windows (.mtw)
Statistical Process Control Using ColorMetrix (.mdb) and Minitab for Windows (.mtw). Presented by Howard Nelson, Ed.D ColorMetrix 4th Annual User Group Meeting August 8-10, 2004 • Las Vegas, Nevada. Minitab Build 13 (MTBWIN). The Printing Industry Cycle of Despair.

Statistical Process Control Using ColorMetrix (.mdb) and Minitab for Windows (.mtw)
E N D
Presentation Transcript
Statistical Process Control Using ColorMetrix (.mdb) and Minitab for Windows (.mtw) Presented by Howard Nelson, Ed.D ColorMetrix 4th Annual User Group Meeting August 8-10, 2004 • Las Vegas, Nevada
The Printing IndustryCycle of Despair • What do you see as the biggest problem with consistency in your plants??? • Pressrun high and low data points fall outside of aimpoints • Makeovers and reruns
Numerical Naiveté • We’ve all been taught that 2+2 = 4 • Nature is a process that has a cycle • Temperature and Precipitation • 2+2 = 4 in pure math, but in nature, • 2 +2 = x4
Everything is a Process • Printing job cycle • Process the order info • Estimate • Production schedule • Prepress • Images from many sources • Composite layout image • RIP /proof • Plates
Pressrun • Material logistics • Ink, Paper • Plates, blankets, information • Makeready • Register • Run-up to density • Approval
The pressrun • Count • Quality • Finishing • Folding • Binding or Filling • Traffic and shipping
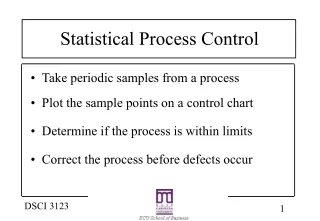
Processes Can Be Measured • Usually, any process can be measured at many points or stages of input • If you can make a measurement, you can turn that measurement into data • The difficulty is in turning that data into information you can understand and act on • Critical task: separating info from noise
Any Process That Can Be Measured Can Be Improved • There are three ways we can make our process look more consistent • Shift the aim-point • Reduce variation in the process • Special-cause variation • Common-cause variation • Change the mathematically-determined specifications
Step 1: Workflow Analysis • Do a three-level workflow analysis to understand where to start looking for trouble • Steering committee? • Made up from all levels of stakeholders at the company
3-level Workflow Analysis • Level 1: Count failure occurrences (by cost centers?) • “Where is the problem and what does it seem due to?” • Level 2: Determine if there are any “Ripe Fruit” problems by collecting enough data to identify it • Level 3: Address chronic process inconsistency
Step 2: Process Mapping • Chart your workflow (Plan for several drafts) • Identify each process input point • Describe the kind of data that can be collected at each of these points • List suppliers and customers for each point • Map backwards from the error point
Generic Process Map The Improvement Process Map the Process Is Process Stable? Identify & Remove Special Causes Measure & Describe the Process No Yes Assess & Understand Process Capability Assess the Measurement System Is Measurement System Capable? Is Process Capable? No Improve the Measurement System Reduce Common Causes No Yes Yes Assess Process Stability Create & Implement Control Plan ($$$$) Strategy: Assess then Improve • Map the Process • Define the Scope • Understand the Process Steps • Measure Process Output • Create a Sampling Plan • Collect Data on the Process • Describe the Process • Numerically and Graphically Summarize the Process • Assess the Measurement Process • Determine Stability, Precision, Bias and Linearity • Take Required Improvement Action • Assess Process Stability • Create a Process Behavior Chart • Identify and Remove Special Causes of Variation if Needed • Assess and Understand Process Capability • Determine the Ability of the Process to Meet Requirements • Understand the How the Inputs Effect the Outputs • Take Required Improvement Action • Establish and Implement Process Controls
Collect the Data • Example: on a hand-operated press, how do we get consistent product? • Factors • Pantone 032 • Coated paper • Spectrophotometer • Number of Remakes (caused by the failures) • Remake % Rate? • Try to collect at least 30 data points
Transfer the Data to Minitab • Step-by-step procedure to export data base to MTW • Step 1: Quit all ColorMetrix Applications • Step 2: Locate the ColorMetrix.mdb database, usually found in C:\program files\colormetrix\colormetrix.mdb
Step by Step, Continued • Step 3: Open the database using Microsoft Access
Step by Step, Continued • Step 4: Locate the table that contains the data needed. (In our example, the magenta data base is the file that contains the data we need for Minitab)
Step by Step, Continued • Step 5: Scroll to, select and copy the data needed for Minitab
Step by Step, Continued • Step 6: Open Minitab and paste the data into a new Minitab worksheet • Step 7: Clean up the worksheet by deleting the unnecessary columns from Colormetrix database
To Baseline Your Process… Measure Performance Analyze Performance Improve Performance Control Performance Can We Measure the Process? Is the Process Predictable? Is the Process Capable?
Step 3: Conduct aProcess Description x o Sigma X1 Sigma X2 Mean X • Collect data to baseline or benchmark your process • Find placement of the median, • Find the spread of the data,
Run Basic Statistics • Display the Minitab worksheet • Path = Stat > Basic Statistics > Display Descriptive Statistics
Basic Statistics • Data needed: Mean & standard deviation for use in later functions x 6
Step 4: Search for Special Cause Variation • Run data in Minitab’s I-MR function • Path = Stat > Control Charts > I-MR
I-MR Chart • Count the number of violations of the natural process limits
Step 5: Conduct the CAPA (Process Capability Analysis) Run data using the Process Capability tool Path = Stat > Quality Tools > Capability Analysis (Normal)
Process Stability Analysis • The Cp index • Ratio of the spec limits to the width of the process • Cp > 2 means the process is stable • Cp = 1 or less means the process is unstable
Process Stability Analysis • The Cpk index • Ratio of the process width to the spec width including centering of the spec on the process • Cpk > 1 means the process is capable of meeting spec • Cpk = 1 or less means the process is incapable of meeting spec
Step 6: Address Common Cause Variation There are 2 ways to reduce variation using process experiments OVAT (One Variable At a Time) Move one variable at a time and collect data Keep that up until all variables are exhausted Good for problems that have 2 factors at 2 levels Too slow if trying to integrate more factors
Design of Experiment-Factorial Analyzes up to 32 factors simultaneously Example: Compare the performances of Pantone 032 printing ink with variables in printing pressure, printing speed and ink roller loading
DOE-F Slow Speed Record % Dot Gain at each factorial point High pressure Low Pressure High ink loading Fast Speed Low ink loading
In this plan, the key is in the structure of columns 5, 6, and 7. DOE-F Control Plan
DOE-F Control Plan • Printing pressure is changed randomly • Press speed alternated every other run • Ink roller loading is alternated every 4th run • This combination assures that all combinations of factors are tested and data from each factorial is compared
Repeatability Variation in the Measurement Instrument Reproducibility Variation Under Different Conditions Stability Total Variation over Time Accuracy (Bias) Difference Between the Average of the Observed and the “True” Value Linearity Difference in Bias in the Operating Range Definitions
The Measurement Systems Analysis • We can’t assume that our measurement devices are accurate • If not accurate, that must be known • if uncorrectable, they must be improved • The Measurement System is a Process • As a Process it Has Variation in its Output
The MSA • Treats the measurement system itself as a source of variation in the process • Test to determine the repeatability and reproducibility of measurement • Seeks to define variation in the process • Separates those variables from other variation in the process • Defines the Difference Between the terms Accuracy and Precision
The Gage R&R • The measurement system is comprised of: • The units being measured • The gauge or measuring instrument itself • Operators in the measurement process • The measuring methods
Accuracy vs Precision RR Average Bias True Value • Precision (RR) • Describes Variation and Spread • The Extent to Which the Instrument Repeats its results when Making Repeat Measurements on the Same Unit of Output • Accuracy (Bias) • Describes Average and Location • Closeness to the True Value • The Extent to Which the Average of a Long Series of Repeat Measurements Made by the Instrument on a Single Unit of Output Differs from the True Value • Systematic Error: Contribution to the Total Error Comprised of all Sources of Variation that Tends to Offset Consistently the Results • Precision and Accuracy are Independent of Each Other • Generally, Separate Actions are Required for Improvement Precise, but not Accurate RR Average Bias True Value Accurate, but not Precise Bias Average RR True Value Accurate, and Precise
Bias and Linearity Perform Bias and Linearity Calculations Bias, or accuracy, is the difference between the average value of the measurements compared to a known standard Linearity, or offset, determines if that bias exists to the same amount or value over the entire operating scale-range of the instrument
MSA Stability Analysis Determine whether the measurement system’s bias drifts over time Monitor the sample average and the average moving range over time Uses I-MR charts to monitor the stability of your measurement process Specifies the accuracy, repeatability and reproducibility of your measurement system
Ideas to Get You Started List what measures you routinely see Identify the measures you use from the list Pick three measures you actually use and plot them on a process behavior chart Ask yourself if you are collecting the right data Insist upon analyzing data within their context
Filter out the noise of routine variation before analyzing variation Don’t try to explain noise in the system A process that is predictable is performing as consistently as possible right now Distinguish between the voice of the process and the voice of the customer Take action on assignable causes
Thanks • ColorMetrix Technologies LLC • Jim Raffel • Mike Litscher • Mike Woods • Flint Ink, Inc. • Jeff Gilbert • Craig Stone
At the End of Today • ColorMetrix / Minitab Data Breakout Session • Interested in some hands-on?? • Mike Woods and Howard Nelson will host a breakout session for those who would like more info about data analysis