Methodology
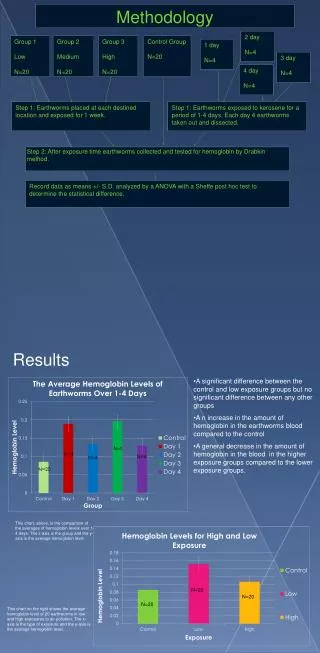
This study investigates the impact of kerosene exposure on earthworm hemoglobin levels. Earthworms were placed in designated locations and exposed to kerosene for varying durations (1-4 days) across different exposure groups: Low, Medium, High, and a Control. The hemoglobin levels were assessed using the Drabkin method, with significant differences noted between the control and low exposure groups, while no significant differences were observed among medium and high exposure groups. Data were statistically analyzed using ANOVA and Sheffe post hoc tests.

Methodology
E N D
Presentation Transcript
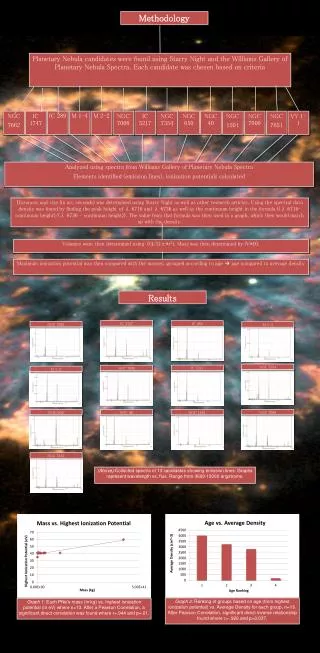
Methodology 2 day N=4 Group 1 Low N=20 Group 2 Medium N=20 Group 3 High N=20 Control Group N=20 1 day N=4 3 day N=4 4 day N=4 Step 1: Earthworms placed at each destined location and exposed for 1 week. Step 1: Earthworms exposed to kerosene for a period of 1-4 days. Each day 4 earthworms taken out and dissected. Step 2: After exposure time earthworms collected and tested for hemoglobin by Drabkin method. Record data as means +/- S.D. analyzed by a ANOVA with a Sheffe post hoc test to determine the statistical difference. Results • A significant difference between the control and low exposure groups but no significant difference between any other groups • A n increase in the amount of hemoglobin in the earthworms blood compared to the control • A general decrease in the amount of hemoglobin in the blood in the higher exposure groups compared to the lower exposure groups. This chart, above, is the comparison of the averages of hemoglobin levels over 1-4 days. The x-axis is the group and the y-axis is the average hemoglobin level. This chart on the right shows the average hemoglobin level of 20 earthworms in low and high exposures to air pollution. The x-axis is the type of exposure and the y-axis is the average hemoglobin level.