Download
1 / 39
390 likes | 413 Vues
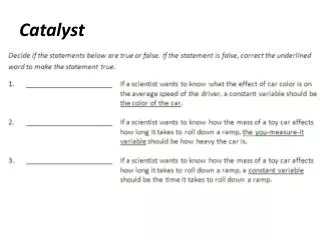
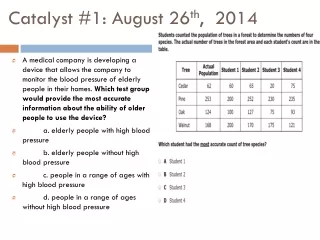
Catalyst #1: August 26 th , 2014. A medical company is developing a device that allows the company to monitor the blood pressure of elderly people in their homes. Which test group would provide the most accurate information about the ability of older people to use the device?

E N D
Catalyst #1: August 26th, 2014 • A medical company is developing a device that allows the company to monitor the blood pressure of elderly people in their homes. Which test group would provide the most accurate information about the ability of older people to use the device? • a. elderly people with high blood pressure • b. elderly people without high blood pressure • c. people in a range of ages with high blood pressure • d. people in a range of ages without high blood pressure
Agenda • Catalyst: 5 minutes • Human Population Graphs (5 minutes) • Carrying Capacity PowerPoint (20 minutes) • Carrying Capacity Graphic Organizer (10 minutes) • Exit Ticket (Remaining ) • Homework: Carrying Capacity Quiz on Thursday • DBA #2 due on 8/28 • Honors Projects due 9/26
Announcements • Office hours today • Carrying Capacity Quiz on Thursday • Dojo prizes • Employees
Objectives • SWBAT name three major factors that determine population growth. • SWBAT define immigration and emigration. • SWBAT describe exponential growth and identify an exponential growth curve. • SWBAT define carrying capacity and identify the (limiting) factors that contribute to the carrying capacity for a population • SWBAT predict changes in population size based on limiting factors and carrying capacity in an ecosystem • SWBAT interpret a growth curve for a population
Vocab Review • Abiotic • Biotic • Producer, Primary Consumer, Secondary Consumer, Tertiary Consumer • Population • Species
How Many? • We have learned about populations of organisms increasing or decreasing in size based on changing biotic and abiotic factors • Biotic? • Abiotic? • But what controls how many organisms exist in a population in the first place?
Human Population Maps • http://www.prb.org/Publications/Datasheets/2012/world-population-data-sheet/world-map.aspx#/map/population
Key Point 1 • Three main factors determine whether a population increases or decreases: number of births, number of deaths, or number of individuals that move into or out of an area. • Immigration is the movement of individuals into an area (Into = Immigration) • Emigration is the movement of individuals out of an area (Exit = Emigration)
Key Point 2 • Under ideal conditions, with unlimited resources and space, a population will experience exponential growth. • Actual populations stabilize rather than growing endlessly.
These resources are our limiting factors What determines population? • Why can’t we have1,000,000 students here at Overton? • Space • Teachers • Supplies • Student Behavior
Limitations on Populations • There can never be an unlimited number of organisms in a population in an ecosystem. • Why?
Key Point 3: Carrying Capacity • An ecosystem can only support as many organisms as it has resources and space for • Carrying capacity = maximum number of organisms that can live in one population in an ecosystem over time • Every species has a different carrying capacity. • Review populations Food and water, space, and predators are the limiting factors that determine carrying capacity for a population
Imagine Your Fridge Your fridge is like all of the resources (food, water, free space) in an ecosystem. What if we want to throw a party?
Imagine Your Fridge We can keep inviting people, as long as there’s enough food in the fridge. But with each new guest, there’s less to go around.
Imagine Your Fridge The fridge won’t replenish magically, and I don’t have the money to keep putting food in the fridge forever. So too many guests means that… So too many animals means that… Someone goes hungry… Not enough food/water/free space… And leaves the party. And organisms die.
Key Point 4: • There are two types of limiting factors: density-dependent limiting factors and density-independent limiting factors.
Key Point 4 Continued • Density-dependent limiting factors have more of an effect on large or crowded populations. • Examples: Competition, Predation, Space • Density-independent limiting factors can affect both large and small populations. • Example: Earthquake, Volcanic eruption
Key Point 5: Carrying Capacity • A population growth curve can be used to predict changes inpopulation sizeand to identifycarrying capacity
Carrying Capacity • When a population is below its carrying capacity (B), it increasesin size • Plenty of food and space • Birth rate is higher than death rate
Carrying Capacity • When a population is above its carrying capacity (A), it decreases in size • Not enough food and space; or too many predators • Death rate is higher than birth rate
Carrying Capacity • This happens over and over… but the increases and decreases get smaller and smaller…
Carrying Capacity • Eventually, population size stabilizes at the carrying capacity (C) • Eventually, population size stabilizes and slow nearly to zero at the carrying capacity (C) for the environment • This S-shaped curve is known as a logistic curve • Birth rate = death rate
CFU 1 On what date did the rabbits reach their carrying capacity?
CFU 2 Why does the rabbit population increase in the highlighted region?
CFU 3 A fire kills grass and other producers in the ecosystem. What will happen to the carrying capacity for rabbits?
determined by such as above it below it WORD BANK: water, carrying capacity, pop. size increases, limiting factors, food, pop. size decreases, space
Summary • An environment can only support as many organisms as there is available food, water, and free space • Carrying capacity = maximum number of organisms that can live in an ecosystem based on these limiting factors • We can read a population growth curve to predict changes in population size • Below carrying capacity = increase in size • Above carrying capacity = decease in size • Over time, population stabilizes at carrying capacity
Exit Ticket • What are three limiting factors that determine the carrying capacity of a population in an ecosystem? • What is happening to the population at point A in the graph and why? • What is happening to the population at point B in the graph and why? • What is the carrying capacity for the population based on the graph shown?
Catalyst #2: August 27th, 2014 • 1. When did the rabbits reach carrying capacity? How do you know? • 2. What is happening to the population during June?
Agenda • Catalyst: 5 minutes • Oh Deer! Simulation: 20 minutes • Population Graphing: 20 minutes • Homework: Population Graphing (If not completed) • Study for Carrying Capacity Quiz • DBA #2 due 8.28 • HP: 9/26
Announcements • Energy Flow quiz make-up • CC quiz tomorrow
Objectives • SWBAT define carrying capacity and identify the (limiting) factors that contribute to the carrying capacity for a population • SWBAT predict changes in population size based on limiting factors and carrying capacity in an ecosystem • SWBAT interpret a growth curve for a population
Oh Deer! Simulation • Number off: Ones = Deer; Twos = Habitat • Line up back to back • Deer choose what resource they are seeking: food, water, habitat (hand signals for each) • Habitats choose what resource they are: food, water, habitat (hand signals for each) • When I say go: • Turn around • Deer go to resource with same signal! • If two deer go to the same resource • Deer take resource back to their side; Deer without resources “die” and join the habitat side; Habitats taken to the deer side become deer because of successful “reproduction”
Population Growth Practice • Discuss the results of your graph. What trends do you see? (How does the graph change?) • Did this population reach carrying capacity? Why or why not? If so, indicate WHEN the population reaches carrying capacity and indicate the maximum number of individuals that can be supported. • What factors are responsible for the rabbit growth trend? • If predators like foxes and cats, which often prey on rabbits, were introduced into this environment during the 10th generation, what would happen to the population growth? Explain your answer below:
Honors: Independent Practice • Complete Population Growth Data Set 2 independently
Regular: Independent Practice • Complete Population Growth Data Set 2 independently OR with a partner
Reminders • Carrying Capacity quiz tomorrow • If you do not complete the IP….