INTEGRATED CIRCUITS
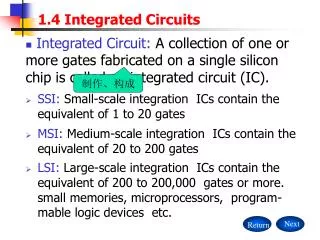
INTEGRATED CIRCUITS. Dr. Esam Yosry. Lec . #2. Chip Fabrication. Silicon Ingots Wafers Chip Fabrication Steps (FEOL, BEOL) Processing Categories Processes. Chip Fabrication Steps.


INTEGRATED CIRCUITS
E N D
Presentation Transcript
INTEGRATED CIRCUITS Dr. EsamYosry Lec. #2
Chip Fabrication • Silicon Ingots • Wafers • Chip Fabrication Steps (FEOL, BEOL) • Processing Categories • Processes
Chip Fabrication Steps • Once the wafers are prepared, many process steps are necessary to produce the desired semiconductor integrated circuit. • In general, the steps can be grouped into two major parts: • Front-end-of-line (FEOL) processing • covers everything (but not including the deposition of metal interconnect layers) • Back-end-of-line (BEOL) processing • individual devices (transistors, capacitors, resistors, etc.) get interconnected with wiring on the wafer
Processing • In semiconductor device fabrication, the various processing steps fall into four general categories: • Deposition • Removal • Patterning • Modification of electrical properties
Processing (1/4) • Depositionis any process that grows, coats, or otherwise transfers a material onto the wafer. • Available technologies include • physical vapor deposition (PVD) • chemical vapor deposition (CVD) • electrochemical deposition (ECD) • molecular beam epitaxy (MBE) • atomic layer deposition (ALD)
Processing (2/4) Removalis any process that removes material from the wafer examples include etch processes (either wet or dry) and chemical-mechanical planarization (CMP).
Processing (3/4) Patterningis the shaping or altering of deposited materials, and is generally referred to as lithography For example, in conventional lithography, the wafer is coated with a chemical called a photoresist; then, a machine called a stepper focuses, aligns, and moves a mask, exposing select portions of the wafer below to short wavelength light; the exposed regions are washed away by a developer solution. After etching or other processing, the remaining photoresist is removed by plasma ashing.
Processing (4/4) Modification of electrical properties has historically entailed doping transistor sources and drains (originally by diffusion furnaces and later by ion implantation). These doping processes are followed by furnace annealing or, in advanced devices, by rapid thermal annealing (RTA); annealing serves to activate the implanted dopants. Modern chips have up to eleven metal levels produced in over 300 sequenced processing steps.
Processes • Oxidation • Diffusion • Ion Implantation • Deposition • Etching • Lithography All these processes are needed to build up different layers in a silicon structure
Oxidation of Silicon (Sio2) Oxidation proceeds by the diffusion of an oxidant (molecular H2O or O2) through the existing oxide to the Si/SiO2 interface. The molecules react with Si to form SiO2. Si (solid) + O2 (vapor) SiO2 (solid) Dry Oxide Si (solid) + H2O (vapor) SiO2 (solid) + 2H2Wet Oxide Thermal Oxidation at 1000oC - 1300oC
Oxidation of Silicon (Sio2) The oxidation reaction occurs at the Si/SiO2 interface. Therefore, as the oxide grows, silicon is consumed and the interface moves into the silicon. SiO2 Surface X0 0.5 X0 SiO2 Original Si Interface Silicon Substrate
Oxidation Equation Deal & Grove model: describes the growth kinetics of oxide films with thicknesses >300Å. x0 = oxide thickness B= Parabolic Rate Constant xi = initial oxide thickness B/A= Linear Rate Constant X0 As temperature increases -A goes down -B goes up -B/A goes up time
Oxidation Rates (Wet) Table 1. RATE CONSTANTS FOR WET OXIDATION OF SILICON OxidationA Parabolic Rate Constant Linear rate constant temperature B B/A (°C) (m) (m2/hr) (m/hr) 1200 0.05 0.720 14.40 1100 0.11 0.510 4.64 1000 0.226 0.287 1.27 920 0.50 0.203 0.406
Oxidation Rates (Dry) Table 2. RATE CONSTANTS FOR DRY OXIDATION OF SILICON Oxidation A Parabolic Rate Constant Linear rate constant temperature B B/A (°C) (m) (m2/hr) (m/hr) 1200 0.040 0.045 1.12 1100 0.090 0.027 0.30 1000 0.165 0.0117 0.071 920 0.235 0.0049 0.0208 800 0.370 0.0011 0.0030 We note that the values of both B and B/A for wet processes is much greater than for dry processes, leading to higher oxidation rates for the wet case.
Oxidation Example Problem: A silicon wafer has 0.5 micron thick layer of SiO2. We now wish to grow additional oxide at 1100C in oxygen for 5 hrs. What is the final oxide thickness (x0)? Answer: From Table 2, A = .09, B = .027. xi = 0.5micron.First calculate . = (.25+.045)/.027 = 10.9 hours This represents the equivalent time that we would have had to oxidize the wafer at 1100C to grow 0.5 micron. The final oxide thickness is calculated using the quadratic formula. = .027x(10.9 +5) = 0.429 x0 = 0.5 [-.09 + (.092 +4X.429)1/2] = 0.61 microns
Measurement of Oxide Thickness • The optical interferencemethod is a simple technique to measure oxide thickness from <100Å to more than 1 m. • The method is based on the interference that occurs between light reflected from the air /SiO2 interface and the Si/SiO2 interface. light SiO2 Xo Silicon
Oxidation Furnace • Oxidation is carried out in a 3-zone resistance-heated furnace (1000oC0.1oC). • The furnace consists of a quartz tube inside a ceramic sheath (heat diffuser). • The quartz tube is filled with oxidant gas in a laminar flow regime. • Inert gas is required for annealing.
Oxidation Charts • These are Xo (oxide thickness in microns) vs. t(oxidation time) at different T (oxidation temperatures from say 700 to 1300oC). Charts for dry, wet, or steam oxidation exist. • The thickness and time are drawn on log scales from 0.01 to 10 on the thickness axis and from 0.1 hr to 100 hr on the time axis. • Knowing the oxidation ambient (dry,wet,..), the oxidation temperature T, and the oxidation time t, we can read Xo directly.
Oxidation Charts (Dry) • If the initial oxide thickness is zero, reading the value of Xo is a direct matter.
Oxidation Example By Charts Problem: A silicon wafer has 0.5 micron thick layer of SiO2. We now wish to grow additional oxide at 1100C in oxygen for 5 hrs. What is the final oxide thickness (x0)? Answer: Foran initial oxide thickness exists 1- find the corresponding oxidation time (toi) at the oxidation temperature. 12 hrs 2- add the actual oxidation time (t). 12 + 5 = 17 hrs 3- read the oxide thickness at time (t+toi). 0.6 µm • Remember to add times not thickness'!.
Thanks Many thanks to Prof. Hany Fikry and Prof WaelFikry for their useful materials that help me to prepare this presentation.