Download

1 / 12
120 likes | 144 Vues
Explore the progress of the DYMECS project in studying convective storms, tracking their evolution, and analyzing model configurations. Discover the challenges and findings in the forecast models. Stay informed about the latest developments and insights in convective storm research.

E N D
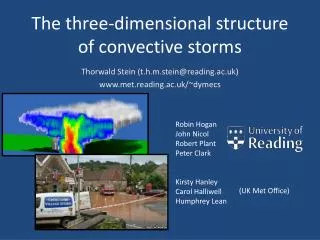
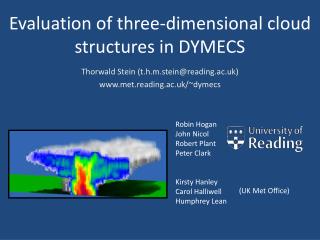
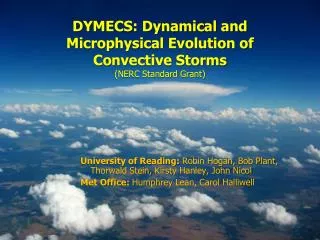
University: Robin Hogan, Bob Plant, Thorwald Stein, Kirsty Hanley, John Nicol Met Office: Humphrey Lean, Emilie Carter, Carol Halliwell, Andy Macallan Forecast models now “resolve” convection… or do they? Significant problems remain with intensity and scale of storms Urgent need to evaluate different model configurations Case studies useful but might not be representative generally In DYMECS we aim to observe hundreds of storms through their lifecycle to evaluate the model statistically Develop adaptive scanning algorithm for Chilbolton to track storms as they evolve Run unmanned during 40 days over an 18-month period including two summers Derive macrophysical, microphysical and dynamical properties vs time in lifecycle Compare variables with assumptions made in some convective parameterizations Track the same properties in storms in the operational 1.5-km Met Office model Rerun model, testing microphysics, sub-grid mixing and resolution Dynamical and Microphysical Evolution of Convective Storms (DYMECS)
Work plan Start of project: April 2011 We are here: Jan 2012
1. Design & test storm tracking algorithm • Nimrod rain rates received at Chilbolton in near real time and 400x400 km region around Chilbolton extracted (John) • Contiguous regions above a certain threshold identified, labelled and tracked from one 5-min to next, allowing for merger and break-up (Thorwald) • Storms are prioritized automatically based on rain rate, area, distance to radar etc (although can “log in” and manually set priority), then scans commands are issued to the radar (Robin & Thorwald) Done.
2. Apply storm tracking over 18 months • Applied to 8 cases so far (4 in August, 2 in Nov and 2 in Dec) • Funding for total of 40 days, focussing on summer 2012 • Note that winter convection also of interest since snow showers often poorly forecast; microphysics is suspect Ongoing.
3. Derive properties from radar scans • Cloud area, cloud-top height versus time into cell lifecycle • Surface rain rate, drop size, hail intensity from polarization variables (Hogan 2007) • Ice water content using radar reflectivity and temperature (Hogan et al. 2006) • TKE and dissipation rate from Doppler spectral width (Chapman and Browning 2001) • Updrafts… Ongoing.
Chapman & Browning (1998) • In quasi-2D features (e.g. squall lines) can assume continuity to estimate vertical velocity Updrafts? • Hogan et al. (2008) • Track features in radial velocity from scan to scan
4. Statistical analysis of observed storms Alan Grant (2007) suggested the following “testable relationships” in convection parameterization: where • eup is the mean in-cloud dissipation rate • wup is the cumulus vertical velocity scale • Lup is the horizontal length scale of the updrafts • Aup is the fractional area of some horizontal domain occupied by cumulus updrafts (equal to the cloud-base mass flux in a convection scheme divided by wup) • Dcld is the depth of the convective cloud layer • CAPE is the convective available potential energy About to start.
5. Cell tracking in operational model • Humphrey and Andy have provided operational model data • 5 minutely for surface rain rate, hourly for 3D fields • Thorwald has tracked storms successfully from rain rate • Kirsty will analyse 3D fields to derive variables for comparison with radar over storm lifecycle Partially done.
6. Modelling case studies & sensitivity tests • mOnSoOn application successful: Emilie & Kirsty can share jobs • Horizontal resolution (Emilie already started) • Down to 100 m; model currently predicts smaller cells as resolution increases • Sub-grid mixing scheme (first task for Kirsty) • Test 2D & 3D Smagorinsky, prognostic TKE and a stochastic backscatter scheme • Evaluate rate of change of cloud size with time, and TKE • Microphysical scheme (can do shortly?) • Test single- and double-moment liquid, rain, ice, snow, graupel and possibly hail, as well as interactive aerosol-cloud microphysics Just starting.
7. Long-term comparison • Choose a suitable resolution, microphysics and sub-grid setting and run model over all observed cases and perform long-term evaluation against radar Not yet started.
8. Synthesis & hypothesis testing • Tackle key scientific questions for convective-scale forecasting • Can models distinguish single cells, multi-cell storms & squall lines? • What about location of daughter cells formed by gust fronts? • Does BL scheme “diffuse away” gust fronts necessary to capture triggering of daughter cells and if so how can this be corrected? • What is cause of quasi-stationary storms (often cause of flooding)? • Can we diagnose parameters that should be used in convection scheme from observations? • Can we estimate entrainment profile in convection from observation-model combination (key uncertainty for climate)? Not yet started.
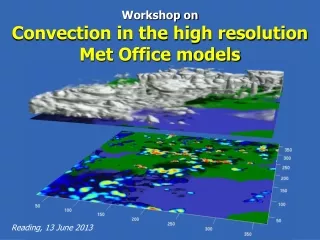
Early 3D reconstructions 16.00 on 26 August 2011 Met Office 1.5 km model Radar observations Rain rate (mm h-1) Forecast plan-view of rainfall National radar network rainfall 3D structure observed by Chilbolton Forecast 3D storm structure