The three-dimensional structure of convective storms
80 likes | 214 Vues
This study utilizes the DYMECS approach to analyze the three-dimensional structure of convective storms using real-time tracking and automatic scanning of Chilbolton radar data. Over a span of approximately 40 days, we derived properties such as vertical velocity, 3D storm structure, rainfall, hail, ice water content, turbulent kinetic energy (TKE), and dissipation rates. Additionally, we evaluated these properties against various model parameters, including resolution and microphysics schemes, to enhance our understanding of storm behavior and rainfall patterns.

The three-dimensional structure of convective storms
E N D
Presentation Transcript
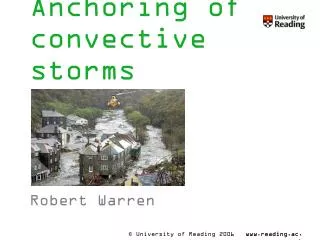
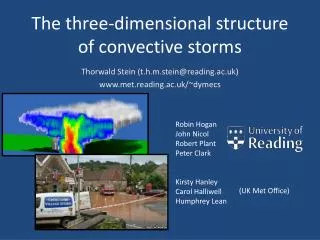
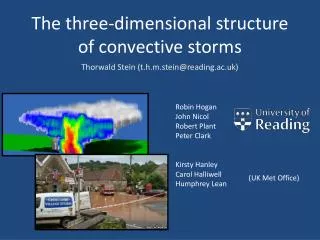
Thorwald Stein (t.h.m.stein@reading.ac.uk) The three-dimensional structure of convective storms Robin Hogan John Nicol Robert Plant Peter Clark Kirsty Hanley Carol Halliwell Humphrey Lean (UK Met Office)
The DYMECS approach: beyond case studies Track storms in real time and automatically scan Chilbolton radar • Derive properties of hundreds of storms on ~40 days: • Vertical velocity • 3D structure • Rain & hail • Ice water content • TKE & dissipation rate NIMROD radar network rainfall • Evaluate these properties in model varying: • Resolution • Microphysics scheme • Sub-grid turbulence parametrization
40 dBZ • 20 dBZ • 0 dBZ Storm structure from radar Radar reflectivity (dBZ) Distance north (km) Distance east (km)
Median storm diameter with height Observations UKV 1500m 200m Drizzle from nowhere? “Shallow” Lack of anvils? “Deep”
Vertical profiles ofreflectivity Conditioned on average reflectivity at 200-1000m below 0oC. Reflectivity distributions forprofiles with thismean Z 40-45 dBZ are shown. 1.5-km 1.5-km + graupel Model: High rainfall rate from shallow storms.Or ice cloud dBZ<0 Observations 200-m 500-m
Missing anvils? z 6 • Define anvil as cloud above 6km with diameter larger than storm diameter at 3km. • More than 40% of storms above 6km have anvil (model and observations). 3 T=0oC R UKV 1500m Observations 200m A selection of individual profiles shows anvil factors will be small (close to 1)
Missing anvils? z Dmax • Define anvil as cloud above 6km with diameter larger than storm diameter at 3km. 6 3 T=0oC R PDF of anvil factor Dmax/D3km
Chapman & Browning (1998) • In quasi-2D features (e.g. squall lines) can assume continuity to estimate vertical velocity Updraft retrieval • Hogan et al. (2008) • Track features in radial velocity from scan to scan