Download
1 / 15
150 likes | 370 Vues
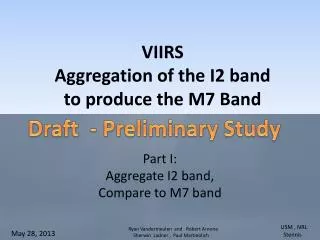
VIIRS Aggregation of the I2 band to produce the M7 Band. Part I: Aggregate I2 band, Compare to M7 band. Draft - Preliminary Study. USM , NRL Stennis. Ryan Vandermeulen and Robert Arnone Sherwin Ladner , Paul Martinolich. May 28, 2013. 2.

E N D
VIIRS Aggregation of the I2 band to produce the M7 Band Part I:Aggregate I2 band,Compare to M7 band Draft - Preliminary Study USM , NRL Stennis Ryan Vandermeulen and Robert Arnone Sherwin Ladner , Paul Martinolich May 28, 2013
2 VIIRS – Visible/NIR Spectrum I2 – 375 and M7 750m Similar Spectral response Band used for Atmospheric Correction
Objective: Can the I2 band at 375 m be aggregated to 750m similar to the M7 bands? What is the correlation between the Aggregated I2 and M7 bands? What affect does it have on the ocean products? - normalized water leaving radiance, , - chlorophyll
Aggregation • November 08, 2012, GOMEX • I-2 band (375m) aggregated to 750-m resolution • 2 x 2 pixel average (non-weighted) • Comparison of Lt (I2 aggregated v M7).
I2_aggregatedM I2 M7 865 M7 Difference I2 – M7 Difference -0.051 0.027
Characterizing the Aggregation Differences in Land and Ocean 750–m resolution Aggregated I-band Lt_865 – Apr20, 2012 Ocean pixels Mean diff = -0.006 Min = -0.017 Max = 0.006 Land pixels Mean diff = 0.017 Min = -0.299 Max = 0.451 I2-M7 difference
Aggregated I2 and M Bands (765 nm) Whole Image Scatterplot Probability density Distribution Off the 1:1 line ! Lt (M7) 0..00 4.0 8.0 12.0 16.00 Land Water 0..00 4.0 8.0 12.0 16.00 Lt (I-2 aggregated)
Impact of Aggregated I2 and M Bands (765 nm) Probability density Distribution Off the 1:1 line ! Water only Lt (M7) 0.19 0.21 0.24 0.26 0.28 Variance of the mean Aggregation The Aggregation is Lower than the M7 band 0.19 0.21 0.24 0.26 0.28 Lt (I-2 aggregated)
Quantifying the Differences Lt: I2 – M7 -0.051 0.027 Difference in the Aggregation ROI Whole image (includes land) Mean = -0.0017 ± 0.0676 ROI (ocean only) Mean = -0.0075 ± 0.0034
Part II: Ocean Color Atmospheric Impact through L2gen (ocean color processing) I2/M7 comparisonDefine: Lt = Top of AtmosphereLt – Lr = Rayleigh Removed La = Aerosol Optical depth I2 - 862nm M7 – 865nm
Apr20, 2012 – Gulf of Mexico I2-band (865 nm) v. M7-band (862 nm) y = 0.9832x + 0.0115 R = .9990 Lt (M band) Lt (I band) TOA Atmospheric Correction Impact • Rayleigh • Corrected • Aerosol Optical • Depth
Part III:Use Aggregated I2, place back into l2gen Ocean Color Processing Impact of I2 aggregated in ocean Products nLw(l)
Impact of the I2 band aggregated with the M bands on nLw ( l ) nLw412 443 using the original M bands n LW (l) 486 using the original M bands n LW (l) 551 Chl a 671 nLw (l) Using the I band aggregated nLw (l) Using the I band aggregated
Chlorophyll mg/m3 Impact of I2 aggregated and M7 on chlorophyll product 3 0 1 2 Chlor_a M7/M6 atmospheric correction Standard 1 2 3 0 Chlor_a I2(agg)/M6 atmospheric correction I2 Aggregated mg/m3 1 0 0.5 Diff - Chlor_a I2 atm_corr – M7 atm_corr Difference
Summary • Notes differences with the Aggregation of I2 and M7 • M7 band has higher values than the I2 Aggregated band - • More scattering in the I2 aggregated in land that water • The variance on the I band 2x2 pixel mean appears to affect the M band comparison • Impact of the I band aggregation at M7 affects the nLw (l). Future : Define the influence of the variance with the 2x2 aggregation Define where the scattering in I2 aggregation is occurring.