Earthquakes
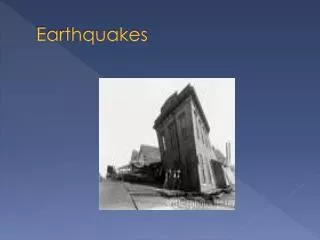
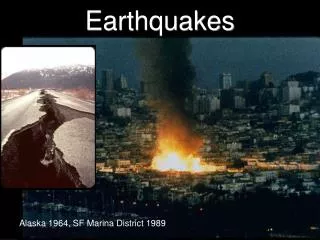
Earthquakes. Alaska 1964, SF Marina District 1989. History of thinking about earthquakes:.

Earthquakes
E N D
Presentation Transcript
Earthquakes Alaska 1964, SF Marina District 1989
History of thinking about earthquakes: • Mid first millennium BC: Anaximenes in ancient Miletus suggested that earthquakes are due to sudden subterranean volume changes such as cave collapse. This view prevailed until the middle of the 19th century. • 1857: Mallet shows that earthquakes occur in belts. He also says that earthquakes are elastic waves • 1884: Gilbert recognizes that geological faults (with large offsets) are the result of many repeated earthquakes (each with small offset). • 1891: The Mino-Dori, Japan earthquake shows actual co-seismic slip. John Milne working for the Emperor notes three kinds of waves • 1906: The San Francisco earthquake provides direct observations of co-seismic slip, rupture length and offset distribution, and co-seismic strain change away from the fault. These give rises to Reid’s rebound theory and to the idea that major faults accommodate very large geological offsets. • 1960’s: The combination of Mallet’s earthquake geography with the shearing slip of faults leads to the idea of plate boundaries.
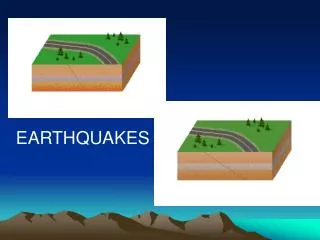
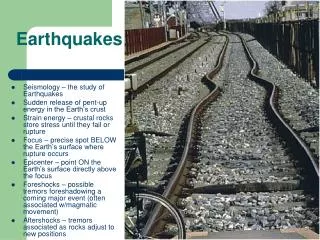
Earthquake terms • earthquake: movement of rock bodies past other • fault: locus of the earthquake movement • faults come at all scales, mm to separation of lithospheric plates (e.g., San Andreas). • focus: site of initial rupture • epicenter: point on surface above the focus
Elastic Rebound Theory I Fig. 18.1a
Elastic Rebound Theory II Fig. 18.1b
Elastic Rebound Theory III Fig. 18.1c
1906 San Francisco Earthquake Fault Offset (~2.5m) Fault Trace Fig. 18.2
Seismic Waves Radiate from the Focus of an Earthquake Fig. 18.3
Seismology • Study of the propagation of mechanical energy; released by earthquakes and explosions through the Earth. • When energy is released in this fashion, waves of motion (like the effect of a pebble tossed into a pond) are set up in the rocks surrounding the source of the energy (the focus). Seismic waves • Waves are started because of initial tension or compression in the rock. • Instruments used to measure these waves are called seismographs.
Global Positioning System (GPS) to Monitor Ground Motion Fig. 18.4 Jet Propulsion Lab/NASA
Seismographs Record Vertical or Horizontal Ground Motion Vertical Horizontal Fig. 18.5a,b
Modern Seismograph Fig. 18.5c Kinematics
Seismograph Record and Pathway of Three Types of Seismic Waves Fig. 18.6
Two kinds of waves from earthquakes • P waves (compressional) 6–8 km/s. Parallel to direction of movement (slinky), also called primary waves. Similar to sound waves. • S waves (shear) 4–5 km/s. Perpendicular to direction of movement (rope); also called secondary waves. Result from the shear strength of materials. Do not pass through liquids.
Comparison of P-wave and S-wave Motion Fig. 18.7
Two Types of Surface Waves Fig. 18.8
Time Lag Between S and P waves as with Distance from Epicenter Fig. 18.9a
Seismic Travel-time Curve Fig. 18.9b
Locating the Epicenter Fig. 18.9c
Locating an epicenter • The difference between the arrival times of the P and S waves at a recording station is a function of the distance from the epicenter. • Therefore, you need three stations to determine the location of an epicenter.
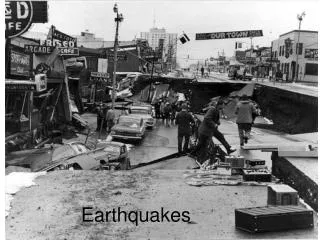
Measuring the force of earthquakes 1. Surface displacement • 1964 Alaska earthquake displaced some parts of the seafloor by ~ 50 ft. • 1906 San Francisco earthquake moved the ground ~8.5 ft. 2. Size of area displaced Alaska — 70,000 sq. miles 3. Duration of shaking Up to tens of seconds 4. Intensity scales Based on damage and human perception 5. Magnitude scales Based on amount of energy released
Modified Mercalli Intensity Scale I Not felt II Felt only by persons at rest III–IV Felt by persons indoors only V–VI Felt by all; some damage to plaster, chimneys VII People run outdoors, damage to poorly built structures VIII Well-built structures slightly damaged; poorly built structures suffer major damage IX Buildings shifted off foundations X Some well-built structures destroyed XI Few masonry structures remain standing; bridges destroyed XII Damage total; waves seen on ground; objects thrown into air
Richter scale based on the amount of energy released 5. Magnitude scales, based on amount of energy released Richter scale: amount of energy received 100 km from epicenter largest quake ever recorded = 9.5 (rocks not strong enough for more). Earthquakes less than M=2 are not felt by people • Largest quake ever recorded = 9.5 (rocks not strong enough for more). • Earthquakes less than M = 2 are not felt by people. About 1million/year • Scale is logarithmic: Increase 1 unit = 10 times greater shaking Increase 1 unit = 30 times greater energy
Maximum Amplitude of Ground Shaking Determines Richter Magnitude Fig. 18.10
Richter Magnitude Versus Energy Fig. 18.11
Before Fault Movement Fig. 18.12a
Normal Fault Fig. 18.12b
Thrust (reverse) Fault Fig. 18.12c
Strike-slip Fault Fig. 18.12d
First Motion of P wave Arrivals Fig. 18.13
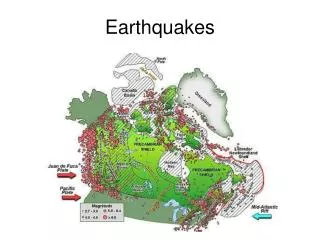
World Seismicity, 1963–2000 Focused around plate margins (but also seen in plate interiors)
Earthquakes Associated with Divergent and Transform Margins Fig. 18.15
Earthquakes Associated with Convergent Plate Margins Fig. 18.16
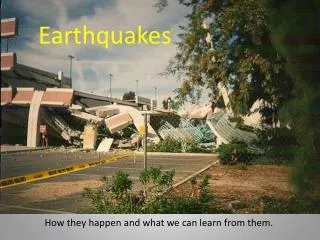
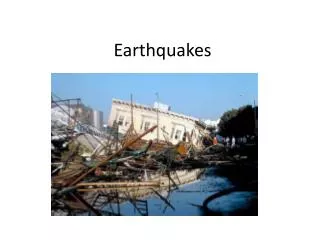
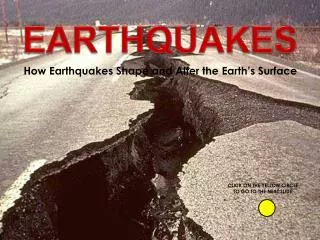
Damage due to earthquakes 1. Ground movement “Earthquakes don’t kill people, buildings kill people.” 2. Fire 3. Tidal waves (tsunami) generate speeds up to 500–800 km/hr in open ocean; only ~ 1m high but get larger when water gets shallow. 4. Landslides All kinds of mass wasting Liquefaction – sudden loss of strength of water-saturated sediment Buildings fall down intact 5. Flood Dam break; courses of rivers change
Effects of the 1995 Kobe, Japan, Earthquake Fig. 18.18 Reuters/Corbis-Bettmann
Generation of a Tsunami Fig. 18.19
Destruction Caused by 1998 Tsunami, Papua New Guinea Fig. 18.20 Brian Cassey/AP Photo
Tsunami Barrier in Taro, Japan Courtesy of Taro, Japan
Ground shaking hazards Seismic Hazard Map
New Housing Built Along the 1906 Trace of the San Andreas Fault Fig. 18.22 R.E. Wallace, USGS
Effects of the 1994 Northridge, CA, Earthquake Fig. 18.17 1994 Chronmo Sohn/Sohn/Photo Resewarchers, Inc