Understanding Graphing in Science: Data Communication and Graph Creation
This guide focuses on the essential aspects of graphing in scientific contexts. It covers the importance of data tables and graphs for making information clear and accessible. You will learn about graph components, including the X-axis (independent variable) and Y-axis (dependent variable), and different types of graphs like bar and line graphs. The content emphasizes standard labeling procedures and highlights the significance of correct scaling to prevent misrepresentation of data. By following outlined steps, you'll be able to design experiments, create data tables, and effectively graph results.


Understanding Graphing in Science: Data Communication and Graph Creation
E N D
Presentation Transcript
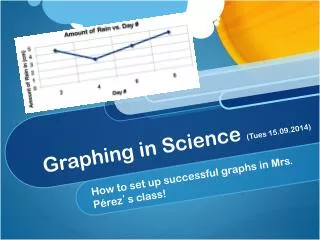
Graphing In Science 2013
Objective • SWBAT (1) Communicate data through tables and graphs. (2) Create appropriate graphs based on data.
What is the purpose of a data table? • Present information in a usable format
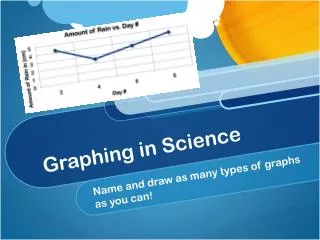
What is the point of a graph? • Make information more accessible • Make information more clear
What are the parts of a graph? Title Y-axis X-axis
What are the parts of a graph? X-axis = IV
What are the parts of a graph? Y-axis = DV X-axis = IV
Dependent vs. Independent Variables • Dependent Variable- depends on the other variable to occur • Growth of a plant depends on days or daylight • Deer population depends on the time of year • Independent Variable- Occurs with or without the dependent variable • Ex-Time • Also known as the • controlled variable • manipulated variable
Types of Graphs/Charts • Bar-Used to compare individual information • Ex- average height of boys vs. girls • Line-Used to compare things over a period of time • Average monthly growth of boys vs. girls over a year • Pie-(Not used in science) Used for percentages
General labeling procedure • “C” The Graph
Line or Bar? • Average Height of students in the class • Growth of fish in a tank over a year • Average household income each month • Number of eggs laid per month • Distance of targets in a throwing competition • Growth of bacteria in a petri dish
Quick Practice (Left Page) Copy this table down and create a line graph for it!
Graphing Reaction Time • Step 1- Design the experiment • Step 2- Determine the dependent and independent variables • Step 3- Create a data table • Step 4- Run experiment • Step 5- Graph information • Choose your graph type • “C” the graph • Choose appropriate scale