Graphing in Physics
270 likes | 628 Vues
Graphing in Physics. Graphing. A way to display data that is collected in an experiment. They must be constructed accurately so data is understood. Three main types of graphs: line, pie and bar. 4 parts of a graph. Title and Axis labels Independent variable Dependent variable

Graphing in Physics
E N D
Presentation Transcript
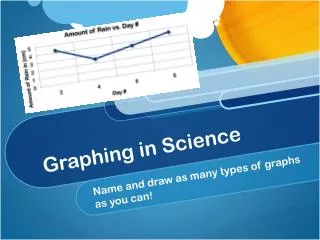
Graphing • A way to display data that is collected in an experiment. • They must be constructed accurately so data is understood. • Three main types of graphs: line, pie and bar.
4 parts of a graph • Title and Axis labels • Independent variable • Dependent variable • Scales for variable
Parts of the Graph • Title- Depicts what the graph is about. It should be a statement placed above the graph to help explain the graph. • Axis labels- gives units and description of data • Independent Variable – is the ONE thing in the experiment that is controlled by the experimenter. It usually concerns, time, depth, or temperature. It is on the horizontal or x-axis.
Parts of Graph • Dependent Variable- is the variable that is directly affected by the changes in the independent variable. This variable is placed on the vertical of y axis. • Scales for each variable- in order to plot a graph you must set a scale to include all the data points. The scale will start with 0 and climb in equal intervals of 2,5,10 etc. The scales for x and y axis can be different.
Graphing Scientific Data • Use the best fit line. You don’t connect dot-to-dot but draw a line that goes through most of the points. • Interpolation is used when you get approximate values that are between points. • Extrapolation is used to approximate values beyond the range of the data.
Accuracy and Neatness in graphing • To convey the data correctly all parts of the graph must be accurate and neat. • Rulers and graph paper should always be used • Graphs must fit the graph paper you can adjustscale so they fit. • A graph is incomplete if the title and axis labels are missing.
vOCABULARY • Precision- the degree of exactness with which a measurement is made and stated • Accuracy- describes how close a measured value is to the true value of the quantity measured • Estimating.- is the calculated approximation of a result