Space and Time
Explore data modeling, processing, and analysis in water resources GIS using space-time models, visualization, and statistics.

Space and Time
E N D
Presentation Transcript
Space and Time By David R. Maidment with contributions from Steve Kopp, Steve Grise, and Tim Whiteaker
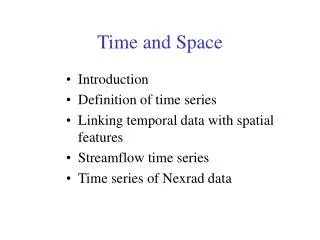
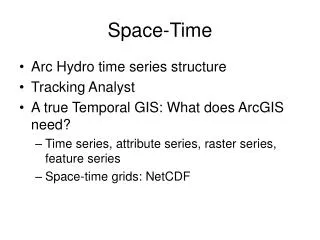
Space and Time • Introductory concepts • Discrete space-time model – Arc Hydro • Temporal Geoprocessing • Continuous space-time model – netCDF • Tracking Analyst
Space and Time • Introductory concepts • Discrete space-time model – Arc Hydro • Temporal Geoprocessing • Continuous space-time model – netCDF • Tracking Analyst
Linking GIS and Water Resources Water Resources GIS Water Conditions (Flow, head, concentration) Water Environment (Watersheds, gages, streams)
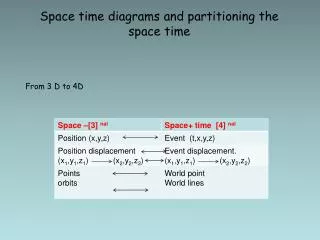
Data Cube A simple data model Time, T “When” D “Where” Space, L Variables, V “What”
Discrete Space-Time Data ModelArcHydro Time, TSDateTime TSValue Space, FeatureID Variables, TSTypeID
Continuous Space-Time Model – NetCDF (Unidata) Time, T Coordinate dimensions {X} D Space, L Variable dimensions {Y} Variables, V
A relational database at the single observation level (atomic model) Stores observation data made at points Metadata for unambiguous interpretation Traceable heritage from raw measurements to usable information CUAHSI Observations Data Model Streamflow Groundwater levels Precipitation & Climate Soil moisture data Water Quality Flux tower data
ODM and HIS in an Observatory Settinge.g. http://www.bearriverinfo.org Pre Conference Seminar
Space, Time, Variables and Observations An observations data model archives values of variables at particular spatial locations and points in time • Observations Data Model • Data fromsensors (regular time series) • Data from field sampling (irregular time points) Variables (VariableID) Space (HydroID) Time
Space, Time, Variables and Visualization A visualization is a set of maps, graphs and animations that display the variation of a phenomenon in space and time • Vizualization • Map – Spatial distribution for a time point or interval • Graph – Temporal distribution for a space point or region • Animation – Time-sequenced maps Variables (VariableID) Space (HydroID) Time
Space, Time, Variables and Simulation A process simulaton model computes values of sets of variables at particular spatial locations at regular intervals of time • Process Simulation Model • A space-time point is unique • At each point there is a set of variables Variables (VariableID) Space (HydroID) Time
Space, Time, Variables and Geoprocessing Geoprocessing is the application of GIS tools to transform spatial data and create new data products • Geoprocessing • Interpolation – Create a surface from point values • Overlay – Values of a surface laid over discrete features • Temporal – Geoprocessing with time steps Variables (VariableID) Space (HydroID) Time
Space, Time, Variables and Statistics A statistical distribution is defined for a particular variable defined over a particular space and time domain • Statistical distribution • Represented as {probability, value} • Summarized by statistics(mean, variance, standard deviation) Variables (VariableID) Space (HydroID) Time
Space, Time, Variables and Statistical Analysis A statistical analysis summarizes the variation of a set of variables over a particular domain of space and time • Statistical analysis • Multivariate analysis – correlation of a set of variables • Geostatistics– correlation space • Time Series Analysis – correlation in time Variables (VariableID) Space (HydroID) Time
Space-Time Datasets CUAHSI Observations Data Model Sensor and laboratory databases Pre Conference Seminar From Robert Vertessy, CSIRO, Australia
Space and Time • Introductory concepts • Discrete space-time model – Arc Hydro • Temporal Geoprocessing • Continuous space-time model – netCDF • Tracking Analyst
Space-Time Cube Time TSDateTime Data Value TSValue FeatureID Space Variable TSTypeID
Arc Hydro TSType Table Units of measure Regular or Irregular Time interval Type Of Time Series Info Recorded or Generated Type Index Variable Name • Arc Hydro has 6 Time Series DataTypes • Instantaneous • Cumulative • Incremental • Average • Maximum • Minimum
Time Series Types Incremental Instantaneous Average Cumulative Minimum Maximum
Space and Time • Introductory concepts • Discrete space-time model – Arc Hydro • Temporal Geoprocessing • Continuous space-time model – netCDF • Tracking Analyst
Time Series {value, time} Feature Series {shape,value, time} Four Panel Diagram Raster Series {raster, time} Attribute Series {featureID, value, time}
Time series from gages in Kissimmee Flood Plain • 21 gages measuring water surface elevation • Data telemetered to central site using SCADA system • Edited and compiled daily stage data stored in corporate time series database called dbHydro • Each time series for each gage in dbHydro has a unique dbkey (e.g. ahrty, tyghj, ecdfw, ….)
Hydraulic head Land surface h Mean sea level (datum) Hydraulic head is the water surface elevation in a standpipe anywhere in a water system, measured in feet above mean sea level
Map of hydraulic head Z Hydraulic head, h h(x, y) x y X Y A map of hydraulic head specifies the continuous spatial distribution of hydraulic head at an instant of time
Time sequence of hydraulic head maps z t3 t2 t1 Hydraulic head, h x y
Time Series {value, time} Feature Series {shape,value, time} Four Panel Diagram Raster Series {raster, time} Attribute Series {featureID, value, time}
Inundation d h L Depth of inundation = d IF (h - L) > 0 then d = h – L IF (h – L) < 0 then d = 0
Inundation Time Series d(x,y,t) = h(x,y,t) – LT(x,y) h (x,y,t) LT(x,y) d(x,y,t) t Time DEMO: DHI Time Series
Ponded Water Depth Kissimmee River June 1, 2003
Time Series {value, time} Feature Series {shape,value, time} Four Panel Diagram Raster Series {raster, time} Attribute Series {featureID, value, time}
Depth Classification Depth Class 11 5 9-10 4 7-8 3 5-6 2 3-4 1 1-2 0 0 -1
Space and Time • Introductory concepts • Discrete space-time model – Arc Hydro • Temporal Geoprocessing • Continuous space-time model – netCDF • Tracking Analyst
Multidimensional Data Data cube (3D) or hypercube (4D,5D…) • Temperature varying with time • Temperature varying with time and altitude T Y X
Multidimensional Data Time = 3 Time = 2 Time = 1
Multidimensional Data Time = 3 Time = 2 Time = 1
Multidimensional Data Time = 1 Time = 2 Data Cube Time = 3 Time Slices
Multidimensional Data Includes variation in (x,y,z,t)
What is NetCDF? NetCDF(network Common Data Form) A platform independent format for representing multi-dimensional array-orientated scientific data. Self Describing - a netCDF file includes information about the data it contains. Direct Access - a small subset of a large dataset may be accessed efficiently, without first reading through all the preceding data. Sharable -one writer and multiple readers may simultaneously access the same netCDF file. NetCDF is new to the GIS community but widely used by scientific communities for around many years