Download
1 / 21
220 likes | 441 Vues
This resource by David R. Maidment, with contributions from Gil Strassberg and Tim Whiteaker, explores the integration of Geographic Information Systems (GIS) with water resource management. Delve into the key concepts of the data cube, which links time, space, variables, and observations. Learn about the critical role of geoprocessing, statistical analysis, and visualization techniques in understanding water flow, concentration, and the environmental conditions of watersheds. This work underscores the power of GIS in modeling and managing our natural resources effectively.

E N D
Space and Time By David R. Maidment with contributions from Gil Strassberg and Tim Whiteaker
Linking GIS and Water Resources Water Resources GIS Water Conditions (Flow, head, concentration) Water Environment (Watersheds, gages, streams)
Data Cube A simple data model Time, TsTime “When” D “Where” Space, FeatureID Variables, VarID “What”
Time Series in the Data Cube (a) TsTime (b) TsTime (c) TsTime 2791 FeatureID FeatureID 2791 FeatureID 6875 6875 VarID VarID VarID {VarID = 6875} gives all data for a variable {FeatureID = 2791} gives all data for a feature {Feature ID = 2791 and VarID = 6875} gives a time series
Space, Time, Variables and Observations An observations data model archives values of variables at particular spatial locations and points in time • Observations Data Model • Data fromsensors (regular time series) • Data from field sampling (irregular time points) Variables (VariableID) Space (FeatureID) Time
Space, Time, Variables and Visualization A visualization is a set of maps, graphs and animations that display the variation of a phenomenon in space and time • Vizualization • Map – Spatial distribution for a time point or interval • Graph – Temporal distribution for a space point or region • Animation – Time-sequenced maps Variables (VariableID) Space (FeatureID) Time
Space, Time, Variables and Simulation A process simulaton model computes values of sets of variables at particular spatial locations at regular intervals of time • Process Simulation Model • A space-time point is unique • At each point there is a set of variables Variables (VariableID) Space (FeatureID) Time
Space, Time, Variables and Geoprocessing Geoprocessingis the application of GIS tools to transform spatial data and create new data products • Geoprocessing • Interpolation – Create a surface from point values • Overlay – Values of a surface laid over discrete features • Temporal – Geoprocessing with time steps Variables (VariableID) Space (FeatureID) Time
Space, Time, Variables and Statistics A statistical distribution is defined for a particular variable defined over a particular space and time domain • Statistical distribution • Represented as {probability, value} • Summarized by statistics(mean, variance, standard deviation) Variables (VariableID) Space (FeatureID) Time
Space, Time, Variables and Statistical Analysis A statistical analysis summarizes the variation of a set of variables over a particular domain of space and time • Statistical analysis • Multivariate analysis – correlation of a set of variables • Geostatistics– correlation space • Time Series Analysis – correlation in time Variables (VariableID) Space (FeatureID) Time
Space-Time Datasets CUAHSI Observations Data Model Sensor and laboratory databases Pre Conference Seminar From Robert Vertessy, CSIRO, Australia
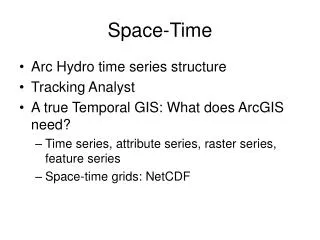
Geospatial time series • Time series = {value, time} • Attribute series = {featureID, value, time} • Fixed geometry, only attributes change with time • Raster series = {raster, time} • Feature series = {shape, value, time} • Both shape and attributes vary in time
Geospatial time series TimeSeries AttributeSeries RasterSeries FeatureSeries
Arc Hydro II: Dataset Overview Variables associations associations [AttributeSeries] workflows workflows [TimeSeries] [FeatureSeries] [RasterSeries] indexes indexes SeriesCatalog DatasetCatalog Framework Extended
Framework Schema • Variables • TimeSeries • SeriesCatalog Variables associations [TimeSeries] indexes SeriesCatalog
Variables • A variable has a name, plus other properties • A variable can be represented by many time series datasets • Indexed by VariableID, or VarKeywhen a String is required Variables VariableID VarNameVarDesc VarUnits SmplMedium VarCode Vocabulary VarKey IsRegular TimeUnits TimeStep DataType NoDataVal
Variables VariableID VarNameVarUnits VarDesc Etc… [TimeSeries] VariableID FeatureID TsTime UTCOffset TsValue [FeatureClass] HydroID Shape TimeSeries Data values indexed by Location, Variable, Time Time TsTime Data value TsValue Space FeatureID Variables VariableID
SeriesCatalog • Indexes time series for a given feature and variable • Supports fast queries to identify data series Time SeriesCatalog SeriesID SeriesID FeatureID FeatClass VariableID TsTable StartTime EndTime ValueCount 2 Where 3 4 What Space When Variables 1
Extended Schema Adds Items • Typically derived from models or observations • Contains • TsTime • UTCOffset • Location Index or Shape • DatasetCatalog indexesentire datasets for a variable [AttributeSeries] workflows [FeatureSeries] [RasterSeries] indexes DatasetCatalog
DatasetCatalog Attribute Series, e.g., NEXRAD DatasetCatalog VariableID DsType DsSource TsTable StartTime EndTime StepCount Feature Series Raster Series