Download
1 / 40
420 likes | 627 Vues
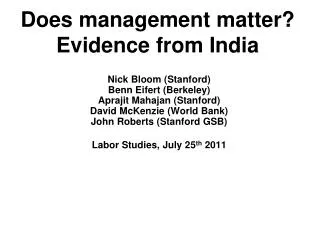
Does management matter? Evidence from India. Nick Bloom (Stanford) Benn Eifert (Berkeley) Aprajit Mahajan (Stanford) David McKenzie (World Bank) John Roberts (Stanford GSB) Labor Studies, July 25 th 2011.

E N D
Does management matter?Evidence from India Nick Bloom (Stanford)Benn Eifert (Berkeley)AprajitMahajan (Stanford)David McKenzie (World Bank)John Roberts (Stanford GSB) Labor Studies, July 25th 2011
One motivation for looking at management is that country management scores are correlated with GDP US Japan Germany Sweden Canada Australia UK Italy France New Zealand Mexico Poland Republic of Ireland Portugal Chile Argentina Greece Brazil China India 2.6 2.8 3 3.2 3.4 Management score Random sample of manufacturing population firms 100 to 5000 employees.Source:Bloom and Van Reenen (2007, QJE) and Bloom and Van Reenen (2010, JEP)
And firm management spreads look like TFP spreads US (N=695 firms) Density India (N=620 firms) Density Management score
But does management cause any of these TFP differences between firms and countries? Massive literature of case-studies and surveys but no consensus Syverson (2011, JEL) “no potential driving factor of productivity has seen a higher ratio of speculation to empirical study”.
So we run an experiment on large firms to evaluate the impact of modern management practices on TFP • Experiment on 20 plants in large multi-plant firms (average 300 employees and $7m sales) near Mumbai making cotton fabric • Randomized treatment plants get 5 months of management consulting intervention, controls get 1 month • Consulting is on 38 specific practices tied to factory operations, quality and inventory control • Collect weekly data on all plants from 2008 to 2010.
They are typically dirty and disorganized Garbage outside the plant Garbage inside a plant Flammable garbage in a plant Chemicals without any covering
Management practices before and after treatment Performance of the plants before and after treatment Why were these practices not introduced before? 11
Intervention aimed to improve 38 core textile management practices in 5 areas Targeted practices in 5 areas: operations, quality, inventory, HR and sales & orders
.6 .5 .4 .3 .2 -10 -8 -6 -4 -2 0 2 4 6 8 10 12 Months after the diagnostic phase Adoption of the 38 management practices over time Treatment plants Control plants Share of 38 practices adopted Non-experimental plants in treatment firms Months after the start of the diagnostic phase
Management practices before and after treatment Performance of the plants before and after treatment Why were these practices not introduced before?
Look at four outcomes we have weekly data for Quality: Measured by Quality Defects Index (QDI) – a weighted average of quality defects (higher=worse quality) Inventory: Measured in log tons Output: Production picks (one pick=one run of the shuttle) Productivity: Log(VA) – 0.42*log(K) – 0.58*log(L) Estimate Intention to Treat (ITT) and also regressions: Run in OLS and also instrument management with treatment.
Poor quality meant 19% of manpower went on repairs Large room full of repair workers (the day shift) Workers spread cloth over lighted plates to spot defects Defects are repaired by hand or cut out from cloth Defects lead to about 5% of cloth being scrapped
Previously mending was recorded only to cross-check against customers’ claims for rebates
Now mending is recorded daily in a standard format, so it can analyzed by loom, shift, design & weaver
The quality data is now collated and analyzed as part of the new daily production meetings Plant managers meet with heads of departments for quality, inventory, weaving, maintenance, warping etc.
Quality improved significantly in treatment plants Control plants Quality defects index(higher score=lower quality) Treatment plants Weeks after the start of the experiment Note: solid lines are point estimates, dashed lines are 95% confidence intervals
Organizing and racking inventory enables firms to substantially reduce capital stock Stock is organized, labeled, and entered into the computer with details of the type, age and location.
Inventory fell in treatment plants Control plants Yarn inventory Treatment plants Weeks after the start of the experiment Note: solid lines are point estimates, dashed lines are 95% confidence intervals
Many treated firms have also introduced basic initiatives (called “5S”) to organize the plant floor Marking out the area around the model machine Snag tagging to identify the abnormalities
Spare parts were also organized, reducing downtime (parts can be found quickly) Nuts & bolts Spare parts Tools
Production data is now collected in a standardized format, for discussion in the daily meetings After (standardized, so easy to enter daily into a computer) Before(not standardized, on loose pieces of paper)
Daily performance boards have also been put up, with incentive pay for employees based on this
TFP rose in treatment plants vs controls Treatment plants Total factor productivity Control plants Weeks after the start of the experiment Note: solid lines are point estimates, dashed lines are 95% confidence intervals
Intention to Treat estimations Standard errors bootstrap clustered by firm.Intervention dummy zero before the intervention and 1 afterwards for the treatment plants. Dropped the 6+ months of data spanning the intervention itself
OLS and IV estimations Standard errors bootstrap clustered by firm. The IV for management is cumulative weeks of treatment.
Management practices before and after treatment Performance of the plants before and after treatment Why were these practices not introduced before? 30
Why doesn’t competition fix badly managed firms? Reallocation appears limited: Owners take all decisions as they worry about managers stealing. But owners time is constrained – they already work 72.4 hours average a week – limiting growth. As a result firm size is more linked to number of male family members (corr=0.689)than management scores (corr=0.223) Entry appears limited:capital intensive due to minimum scale (for a warping loom and 30 weaving looms at least $1m) Trade is restricted: 50% tariff on fabric imports from China
Why don’t these firms improve themselves (even worthwhile reducing costs for a monopolist…)? Asked the consultants to investigate the non-adoption of each of the 38 practices, in each plant, every other month Did this by discussion with the owners, managers, observation of the factory, and from trying to change management practices. Find this is primarily an information problem - Wrong information (do not believe worth doing) - No information (never heard of the practices) 32
Basic practices were most constrained by wrong info (bad priors), advanced practices by lack of info 33 Note: 14 treatment plants. Basic mainly quality and downtime recording, & worker bonuses. Advanced mainly review meetings, standard procedures & managers bonuses.
Summary Management matters in Indian firms – large impacts on productivity and profitability from more modern practices A primary reason for bad management appears to be lack of information, which limited competition allows to persist Potential policy implications A) Competition and FDI: free product markets and encourage foreign multinationals to accelerate spread of best practices B) Training: improved basic training around management skills C) Rule of law: improve rule of law to encourage reallocation and ownership and control separation 34
Can we learn from this small sample? (1/3) Small sample because this is expensive! (~75K per treated plant), why also no prior large-firm management experiments • Is this sample large enough to get significant results? Yes: - Homogeneous production, location, and technology, so most external shocks controlled for with time dummies. • Large plants with 80 looms and 130 employees so individual machine and employee shocks average out • Data from machines & logs so little measurement error • High frequency data: 114 weeks of data (large T)
Can we learn from this small sample? (2/3) 2) Need to use appropriate statistical inference: • Use bootstrap firm-clustered standard-errors as baseline • Also use permutation tests (12,376 possible ways of choosing 11 treated from 17 firms) to get test statistics which don’t rely on asymptotics. • Use large T-asymptoticsfrom Ibramigov-Mueller (2009) • Remove time effects • Estimate parameter of interest separately for each treatment firm, then treat resultant 11 estimates as a draw from a t distribution with 10 d.f. • This provides robustness to heterogeneity across firms also. All three methods give similar results
Can we learn from this small sample? (3/3) 3) External validity: are these firms relatively representative of large firms in developing countries? • While we focus on one region and one industry in one country, it is India’s largest industry in its commercial hub. • Our firms seem at least broadly representative of firms in developing countries in terms of basic management practices (see next slide).
Note - the production technology has not changed much over time Krill Warp beam The warping looms at Lowell Mills in 1854, Massachusetts