Kinetics of ATP and LDH Release from RAW264.7 Cells Induced by Mt-II Toxicity
80 likes | 200 Vues
This study evaluates the kinetics of ATP and LDH release from RAW264.7 macrophages exposed to 1.5 µM Mt-II in mKRB, both with and without the ecto-ATPase inhibitor ARL67156 (100 mM) or EGTA (1.5 mM). Expression profiles of purinergic receptors in RAW264.7 cells were analyzed based on GEO DataSet Record GDS3549. Additionally, the response of N13 cells to Mt-II intoxication, including cytosolic calcium fluctuations and cytotoxicity protection through anion channel inhibitors, is discussed. The findings show the cellular effects and underlying mechanisms of Mt-II-induced cell damage.

Kinetics of ATP and LDH Release from RAW264.7 Cells Induced by Mt-II Toxicity
E N D
Presentation Transcript
Figure S1 Kinetics of ATP and LDH release from RAW264.7 cells induced by 1.5 µM Mt-II in mKRB, with or without an ecto-ATPase inhibitor, ARL67156 (100 mM) or of EGTA (1.5 mM). Values are mean ± SD; n =4.
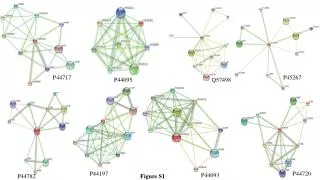
Expression profiling of the purinergic receptors in RAW264.7 cells. Bars represent expression values of purinergic receptors in the three control replicates reported in GEO DataSet Record GDS3549(Bok et al. 2009). Figure S2
Figure S3 N13 cells are sensitive to Mt-II intoxication similarly to macrophages. Cells were incubated with Mt-II in mKRB medium (see experimental section) for one hour, and cell vitality was determined. Values are mean ± SD; n =4-5.
Table S1 Anion channel inhibitors and purinergic antagonists protect N13 cells from Mt-II intoxication Protection of N13 cells from Mt-II induced cytotoxicity by inhibitors of ATP channels, of the purinergic receptors. Inhibitor concentration that was non toxic to cells was used. Data reported are the average values obtained in a minimum of four independent experiments. Statistically significant differences were determined via a one-tailed Student’s t test (*p < 0.05; **p < 0.01;***p>0.001).
Figure S4 N13 cells intoxicated with Mt-II show a rapid peak of cytosolic [Ca2+], followed by a more extended increase which precedes cell bursting, occurring randomly on the plate. J744 cells show a similar behaviour (not shown). N13 cells have been pre-loaded with fura-2 and treated with 3.6 mM Mt-II (arrow). The effect on [Ca 2+ ] was followed as a change in the fura-2 fluorescence ratio (340/380 nm) in the cells that were identified with different colored ROIs in the inset. The panel is representative of experiments carried out under the same conditions in at least four different cell preparations. Video S4 shows gray scale fluorescence images (ratio 340/380 nm, acquisition 1 frame/10 seconds.
Figure S5 ATP (4 mM) induces on N13 cells synchronized spikes of cytosolic [Ca2+], followed by a prolonged but lower rise. J744 show a similar behaviour (not shown). N13 cells were pre-loaded with fura-2 and treated with 4 mM ATP (arrow). The effect on [Ca2+] was followed as a change in the fura-2 fluorescence ratio (340/380 nm) in the cells that were identified with different colored ROIs in the inset. The panel is representative of experiments carried out under the same conditions in at least four different cell preparations. Video S5 shows gray scale fluorescence images (ratio 340/380 nm, 1 frame/10 seconds).
Figure S6 A RAW cells intoxicated with Mt-II (1.5 mMin mKRB) in presence of annexin-V-fluorescein. Membrane blebs induced by intoxication with Mt-II (at least 10 minutes after intoxication) show exposition of phosphatidylserine, as evidenced by the green fluorescence (central panels). Phosphatidylserine exposition induced by the toxin comes before cell membrane rupture, as tested by the lack of staining with propidium iodide (right panel), except for one cell. All experiments were repeated at least three times.
Figure S6 B Control of the experiment reported in Figure S6 A, the same volume of mKRB, but without the toxin, was added to RAW cells treated with annexin-V-fluorescein/propidium iodide.