Fig 2
Expression data from Arabidopsis thaliana (Ler) rosette leaves treated with paraquat ( methyl viologen ). Jon Tomkinson , Hannah Thorpe, Matthew Carr, Fatima Alzahrani and Laila Alharbi. Introduction
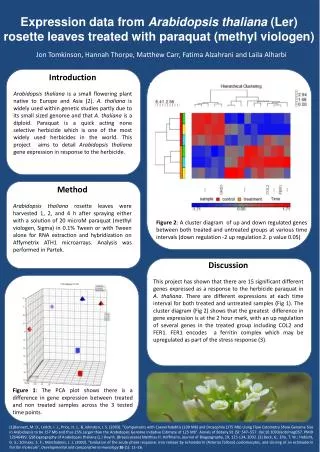

Fig 2
E N D
Presentation Transcript
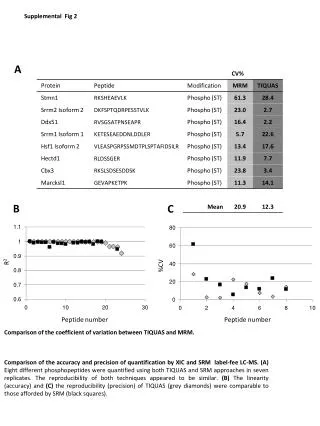
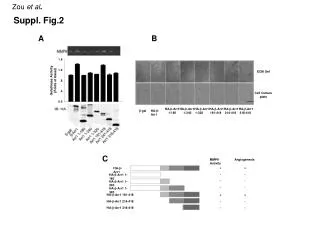
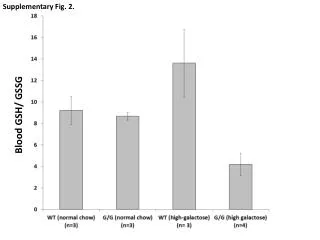
Expression data from Arabidopsis thaliana (Ler) rosette leaves treated with paraquat (methyl viologen) Jon Tomkinson, Hannah Thorpe, Matthew Carr, Fatima Alzahrani and Laila Alharbi Introduction Arabidopsis thaliana is a small flowering plant native to Europe and Asia (2). A. thaliana is widely used within genetic studies partly due to its small sized genome and that A. thaliana is a diploid. Paraquat is a quick acting none selective herbicide which is one of the most widely used herbicides in the world. This project aims to detail Arabidopsis thaliana gene expression in response to the herbicide. Fig 2 Method Arabidopsis thaliana rosette leaves were harvested 1, 2, and 4 h after spraying either with a solution of 20 microM paraquat (methyl viologen, Sigma) in 0.1% Tween or with Tween alone for RNA extraction and hybridization on Affymetrix ATH1 microarrays. Analysis was performed in Partek. Figure 2: A cluster diagram of up and down regulated genes between both treated and untreated groups at various time intervals (down regulation -2 up regulation 2. p value 0.05) Discussion This project has shown that there are 15 significant different genes expressed as a response to the herbicide paraquat in A. thaliana. There are different expressions at each time interval for both treated and untreated samples (Fig 1). The cluster diagram (Fig 2) shows that the greatest difference in gene expression is at the 2 hour mark, with an up regulation of several genes in the treated group including COL2 and FER1. FER1 encodes a ferritin complex which may be upregulated as part of the stress response (3). Fig 1 Figure 1: The PCA plot shows there is a difference in gene expression between treated and non treated samples across the 3 tested time points. (1)Bennett, M. D., Leitch, I. J., Price, H. J., & Johnston, J. S. (2003). "Comparisons with Caenorhabditis (100 Mb) and Drosophila (175 Mb) Using Flow Cytometry Show Genome Size in Arabidopsis to be 157 Mb and thus 25% Larger than the Arabidopsis Genome Initiative Estimate of 125 Mb". Annals of Botany 91 (5): 547–557. doi:10.1093/aob/mcg057. PMID 12646499. (2)Biogeography of Arabidopsis thaliana (L.) Heynh. (Brassicaceae) Matthias H. Hoffmann, Journal of Biogeography, 29, 125-134, 2002. (3) Beck, G.; Ellis, T. W.; Habicht, G. S.; Schluter, S. F.; Marchalonis, J. J. (2002). "Evolution of the acute phase response: iron release by echinoderm (Asterias forbesi) coelomocytes, and cloning of an echinoderm ferritin molecule". Developmental and comparative immunology26 (1): 11–26.