Download
1 / 18
180 likes | 332 Vues
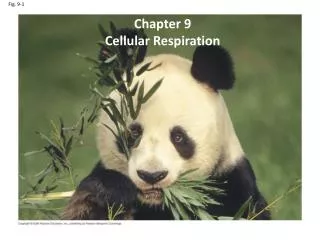
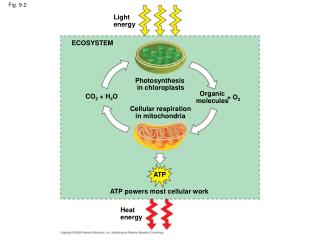
Light energy. ECOSYSTEM. Fig. 9-2. Photosynthesis in chloroplasts. Organic molecules. CO 2 + H 2 O. + O 2. Cellular respiration in mitochondria. ATP. ATP powers most cellular work. Heat energy. becomes oxidized (loses electron). Fig. 9-UN1. becomes reduced (gains electron).

E N D
Light energy ECOSYSTEM Fig. 9-2 Photosynthesis in chloroplasts Organic molecules CO2 + H2O + O2 Cellular respiration in mitochondria ATP ATP powers most cellular work Heat energy
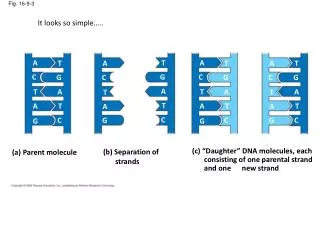
becomes oxidized (loses electron) Fig. 9-UN1 becomes reduced (gains electron)
1/2 O2 H2 + 1/2 O2 + 2 H (from food via NADH) Controlled release of energy for synthesis of ATP 2 H+ + 2 e– Fig. 9-5 ATP Explosive release of heat and light energy ATP Electron transport chain Free energy, G Free energy, G ATP 2 e– 1/2 O2 2 H+ H2O H2O (a) Uncontrolled reaction (b) Cellular respiration
Electrons carried via NADH Fig. 9-6-1 Glycolysis Pyruvate Glucose Cytosol ATP Substrate-level phosphorylation
Glucose ATP 1 Hexokinase ADP Glucose Fig. 9-9-1 Glucose-6-phosphate ATP 1 Hexokinase ADP Glucose-6-phosphate
Glucose ATP 1 Hexokinase ADP Fig. 9-9-2 Glucose-6-phosphate Glucose-6-phosphate 2 Phosphoglucoisomerase 2 Phosphogluco- isomerase Fructose-6-phosphate Fructose-6-phosphate
Glucose ATP 1 1 Hexokinase ADP Fructose-6-phosphate Fig. 9-9-3 Glucose-6-phosphate 2 2 Phosphoglucoisomerase ATP 3 Phosphofructo- kinase Fructose-6-phosphate ATP ADP 3 3 Phosphofructokinase ADP Fructose- 1, 6-bisphosphate Fructose- 1, 6-bisphosphate
Electrons carried via NADH Fig. 9-6-1 Glycolysis Pyruvate Glucose Cytosol ATP Substrate-level phosphorylation
Electrons carried via NADH and FADH2 Electrons carried via NADH Fig. 9-6-2 Citric acid cycle Glycolysis Pyruvate Glucose Mitochondrion Cytosol ATP ATP Substrate-level phosphorylation Substrate-level phosphorylation
CYTOSOL MITOCHONDRION Fig. 9-10 NAD+ NADH + H+ 2 1 3 Acetyl CoA Coenzyme A Pyruvate CO2 Transport protein
Pyruvate CO2 NAD+ CoA NADH + H+ Acetyl CoA CoA Fig. 9-11 CoA Citric acid cycle 2 CO2 FADH2 3 NAD+ NADH 3 FAD + 3 H+ ADP + P i ATP
Acetyl CoA CoA—SH NADH H2O 1 +H+ NAD+ Oxaloacetate 8 Fig. 9-12-8 2 Malate Citrate Isocitrate NAD+ Citric acid cycle NADH 3 + H+ 7 H2O CO2 Fumarate CoA—SH -Keto- glutarate 4 6 CoA—SH 5 FADH2 CO2 NAD+ FAD Succinate NADH P i + H+ Succinyl CoA GDP GTP ADP ATP
Electrons carried via NADH and FADH2 Electrons carried via NADH Fig. 9-6-2 Citric acid cycle Glycolysis Pyruvate Glucose Mitochondrion Cytosol ATP ATP Substrate-level phosphorylation Substrate-level phosphorylation
Electrons carried via NADH and FADH2 Electrons carried via NADH Fig. 9-6-3 Oxidative phosphorylation: electron transport and chemiosmosis Citric acid cycle Glycolysis Pyruvate Glucose Mitochondrion Cytosol ATP ATP ATP Substrate-level phosphorylation Substrate-level phosphorylation Oxidative phosphorylation
NADH 50 e– 2 NAD+ FADH2 e– 2 FAD Multiprotein complexes FAD 40 FMN Fe•S Fe•S Fig. 9-13 Q Cyt b Fe•S 30 Cyt c1 IV Free energy (G) relative to O2 (kcal/mol) Cyt c Cyt a Cyt a3 20 e– 2 10 (from NADH or FADH2) O2 2 H+ + 1/2 0 H2O
H+ H+ H+ H+ Fig. 9-16 Protein complex of electron carriers Cyt c V Q ATP synthase H2O 2 H+ + 1/2O2 FADH2 FAD NAD+ NADH ADP + ATP P i (carrying electrons from food) H+ Chemiosmosis Electron transport chain 1 2 Oxidative phosphorylation
Electron shuttles span membrane MITOCHONDRION CYTOSOL 2 NADH or 2 FADH2 2 NADH 6 NADH 2 FADH2 2 NADH Fig. 9-17 Oxidative phosphorylation: electron transport and chemiosmosis Glycolysis Citric acid cycle 2 Acetyl CoA 2 Pyruvate Glucose + 2 ATP + 2 ATP + about 32 or 34 ATP About 36 or 38 ATP Maximum per glucose:
Electrons carried via NADH and FADH2 Electrons carried via NADH Fig. 9-6-3 Oxidative phosphorylation: electron transport and chemiosmosis Citric acid cycle Glycolysis Pyruvate Glucose Mitochondrion Cytosol ATP ATP ATP Substrate-level phosphorylation Substrate-level phosphorylation Oxidative phosphorylation