Understanding Photosynthesis and Cellular Respiration: Energy Flow in Ecosystems
This comprehensive overview explores the intricate processes of photosynthesis in chloroplasts and cellular respiration in mitochondria. It delves into how light energy is converted into organic molecules via CO2 and H2O during photosynthesis, which subsequently powers cellular activities through ATP generation. The role of glycolysis, the citric acid cycle, and oxidative phosphorylation in energy production is explained, highlighting the importance of electron carriers like NADH and FADH2. This overview provides insights into the interconnected nature of these metabolic pathways in living organisms.


Understanding Photosynthesis and Cellular Respiration: Energy Flow in Ecosystems
E N D
Presentation Transcript
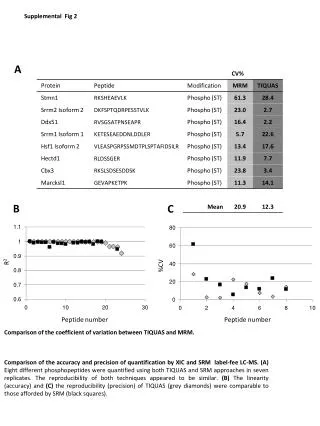
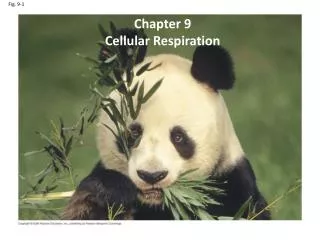
Fig. 9-2 Light energy ECOSYSTEM Photosynthesis in chloroplasts Organic molecules CO2 + H2O + O2 Cellular respiration in mitochondria ATP ATP powers most cellular work Heat energy
Fig. 9-19 Glucose Glycolysis CYTOSOL Pyruvate O2 present: Aerobic cellular respiration No O2 present: Fermentation MITOCHONDRION Acetyl CoA Ethanol or lactate Citric acid cycle
Fig. 9-10 CYTOSOL MITOCHONDRION NAD+ NADH + H+ 2 1 3 Acetyl CoA Coenzyme A Pyruvate CO2 Transport protein
Fig. 9-6-3 Electrons carried via NADH and FADH2 Electrons carried via NADH Oxidative phosphorylation: electron transport and chemiosmosis Citric acid cycle Glycolysis Pyruvate Glucose Mitochondrion Cytosol ATP ATP ATP Substrate-level phosphorylation Substrate-level phosphorylation Oxidative phosphorylation
Fig. 9-11 Pyruvate CO2 NAD+ CoA NADH + H+ Acetyl CoA CoA CoA Citric acid cycle 2 CO2 FADH2 3 NAD+ NADH 3 FAD + 3 H+ ADP + P i ATP
Fig. 9-12-8 Acetyl CoA CoA—SH NADH H2O 1 +H+ NAD+ Oxaloacetate 8 2 Malate Citrate Isocitrate NAD+ Citric acid cycle NADH 3 + H+ 7 H2O CO2 Fumarate CoA—SH -Keto- glutarate 4 6 CoA—SH 5 FADH2 CO2 NAD+ FAD Succinate NADH P i + H+ Succinyl CoA GDP GTP ADP ATP
CoA—SH NADH 1 +H+ NAD+ 8 Malate Citric acid cycle 3 7 H2O CO2 Fumarate CoA—SH -Keto- glutarate 4 6 CoA—SH 5 FADH2 CO2 NAD+ FAD CO2 Succinate NADH P i + H+ Succinyl CoA GDP GTP ADP ATP
Fig. 9-17 Electron shuttles span membrane MITOCHONDRION CYTOSOL 2 NADH or 2 FADH2 2 NADH 6 NADH 2 FADH2 2 NADH Oxidative phosphorylation: electron transport and chemiosmosis Glycolysis Citric acid cycle 2 Acetyl CoA 2 Pyruvate Glucose + 2 ATP + 2 ATP + about 32 or 34 ATP About 36 or 38 ATP Maximum per glucose:
Fig. 9-16 H+ H+ H+ H+ Protein complex of electron carriers Cyt c V Q ATP synthase H2O 2 H+ + 1/2O2 FADH2 FAD NAD+ NADH ADP + ATP P i (carrying electrons from food) H+ Chemiosmosis Electron transport chain 1 2 Oxidative phosphorylation
Fig. 10-16 Mitochondrion Chloroplast MITOCHONDRION STRUCTURE CHLOROPLAST STRUCTURE Diffusion H+ Thylakoid space Intermembrane space Electron transport chain Inner membrane Thylakoid membrane ATP synthase Stroma Matrix Key ADP + P i ATP Higher [H+] H+ Lower [H+]