Comparative Analysis of siRNA Effects on BT-474, MCF-7, SK-BR-3, and MDA-MB-231 Cell Lines
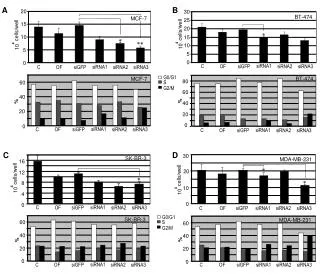
This study investigates the impact of siRNA1, siRNA2, and siRNA3 on cell cycle distribution in breast cancer cell lines BT-474, MCF-7, SK-BR-3, and MDA-MB-231 using flow cytometry. Results show differences in cell cycle phases following siRNA treatment.

Comparative Analysis of siRNA Effects on BT-474, MCF-7, SK-BR-3, and MDA-MB-231 Cell Lines
E N D
Presentation Transcript
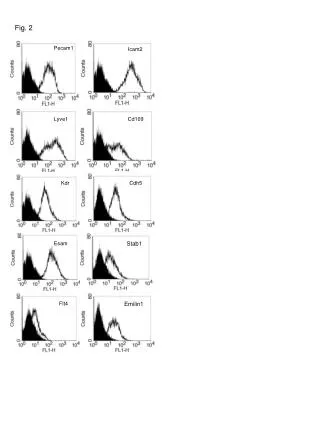
Fig. 2 A B 20 30 BT-474 cells/well MCF-7 25 15 20 4 10 10 15 10 5 siRNA1 C OF siGFP siRNA2 siRNA3 5 0 0 G0/G1 G0/G1 80 S S G2/M G2/M BT-474 MCF-7 60 60 40 40 % % 20 20 0 siRNA1 siRNA1 siRNA1 siRNA1 C C C C OF OF OF OF siGFP siGFP siGFP siGFP siRNA2 siRNA2 siRNA2 siRNA2 siRNA3 siRNA3 siRNA3 siRNA3 0 C D 30 SK-BR-3 MDA-MB-231 cells/well 16 cells/well cells/well 20 12 4 4 4 10 10 10 8 10 C OF siGFP siRNA1 siRNA2 siRNA3 4 0 0 SK-BR-3 MDA-MB-231 60 60 40 40 % % 20 20 siRNA1 C OF siGFP siRNA2 siRNA3 0 0 C OF siGFP siRNA1 siRNA2 siRNA3