Download
1 / 30
300 likes | 440 Vues
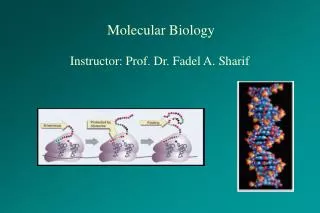
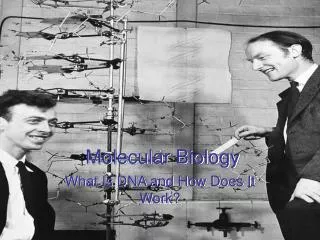
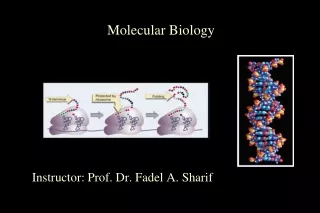
This comprehensive study explores DNA structure and replication mechanisms, utilizing various experimental techniques involving radioactive proteins and phages. Through a series of figures, we illustrate the processes of DNA infection in bacterial cells, the construction of DNA strands, and the stages of DNA replication during the cell cycle. By using centrifugation and radioactivity measurements, we gain insights into the genetic information transfer and protein synthesis, highlighting key components such as nucleotides, RNA transcription, and translation into polypeptides.

E N D
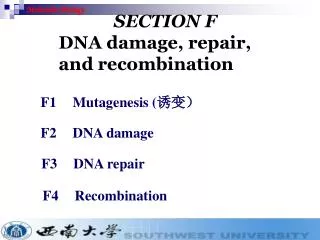
Head Fig. 10-1a DNA Tail Tail fiber
Radioactive protein Empty protein shell Phage Radioactivity in liquid Bacterium Phage DNA DNA Batch 1 Radioactive protein Fig. 10-1b Centrifuge Pellet Agitate in a blender to separate phages outside the bacteria from the cells and their contents. Centrifuge the mixture so bacteria form a pellet at the bottom of the test tube. Mix radioactively labeled phages with bacteria. The phages infect the bacterial cells. 2 3 4 Measure the radioactivity in the pellet and the liquid. 1 Radioactive DNA Batch 2 Radioactive DNA Centrifuge Radioactivity in pellet Pellet
Nitrogenous base (A, G, C, or T) Phosphate group Fig. 10-2aa Thymine (T) Sugar (deoxyribose)
Fig. 10-2b Thymine (T) Cytosine (C) Guanine (G) Adenine (A) Pyrimidines Purines
Nitrogenous base (A, G, C, or U) Phosphate group Fig. 10-2c Uracil (U) Sugar (ribose)
Base pair Fig. 10-3da Ribbon model
Fig. 10-4a-3 Nucleotides Parental molecule of DNA Both parental strands serve as templates Two identical daughter molecules of DNA
3 end 5 end P 5 2 4 3 3 1 1 4 2 5 P Fig. 10-5b P P P P P P 5 end 3 end
Parental strand Origin of replication Daughter strand Fig. 10-5a Bubble Two daughter DNA molecules
DNA polymerase molecule 3 5 Daughter strand synthesized continuously Parental DNA 5 3 Daughter strand synthesized in pieces Fig. 10-5c 3 5 5 3 DNA ligase Overall direction of replication
Protein Synthesis occurs during G0, G1 and G2 of the cell cycle
DNA Transcription Fig. 10-6a-3 RNA Nucleus Cytoplasm Translation Protein
DNA strand Transcription Fig. 10-7a RNA Codon Translation Polypeptide Amino acid
RNA polymerase DNA of gene Promoter DNA Terminator DNA 1 Initiation Fig. 10-9b Area shown in Figure 10.9A 2 Elongation Growing RNA 3 Termination Completed RNA RNA polymerase
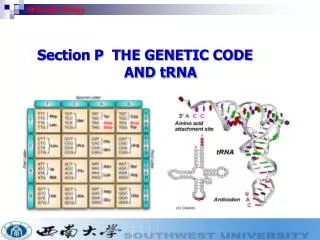
Second base Fig. 10-8a First base Third base
Growing polypeptide tRNA molecules Large subunit Fig. 10-12a mRNA Small subunit
Next amino acid to be added to polypeptide Fig. 10-12c Growing polypeptide tRNA mRNA Codons
Amino acid Polypeptide A site P site Anticodon mRNA Codons 1 Codon recognition Fig. 10-14-4 mRNA movement Stop codon Peptide bond formation 2 New peptide bond Translocation 3
Normal hemoglobin DNA Mutant hemoglobin DNA Fig. 10-16a mRNA mRNA Sickle-cell hemoglobin Normal hemoglobin Glu Val
Normal gene mRNA Protein Lys Met Phe Ala Gly Fig. 10-16b Base substitution Lys Met Phe Ala Ser Base deletion Missing Lys Met Leu His Ala