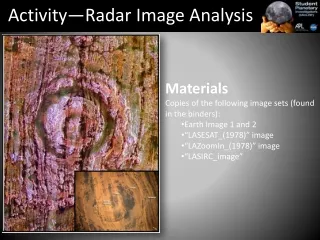
Activity—Radar Image Analysis
Compare and analyze Earth images obtained through radar and infrared technologies. Understand the electromagnetic spectrum and the applications of radar imaging in Earth observation. Learn about radar energy and its advantages over visible light.

Activity—Radar Image Analysis
E N D
Presentation Transcript
Activity—Radar Image Analysis • Materials • Copies of the following image sets (found in the binders): • Earth Image 1 and 2 • “LASESAT_(1978)” image • “LAZoomIn_(1978)” image • “LASIRC_image”
Purpose • In this activity, we will compare visible, infrared, and radar images using data sets from various spacecraft
Background • Visible Light—allows to see color variations • Limitations: can only see the surface…what is below the surface that we cant see?
Part 1—Viewing Earth from Space • Brainstorming (10 min) • What I know • Describe what you think you know about infrared, or IR energy • NOTE: • You may or may not know what infrared (IR) energy is. • Remember, you are just putting down your ideas on paper. • IR waves are not visible to the human eye
What is a wavelength? • Wavelength is the distance from one wave crest to the next wave crest
Electromagnetic Spectrum • Using a cell phone camera, you can actually see IR waves from a remote control. • Heat is a form of Infrared energy
Galileo—Jupiter Mission 1989 • Path allowed for additional views of Earth with its cameras
Part 2: Comparing IR images and Vis images • Earth Image 1 and 2 • What are some of the similarities and differences you are seeing in the images? • What sort of instrument do you think took Earth Image 1? • What aspects of Earth Image 1 would lead you to guess that there might be life on this planet? • Now, look at the image called Earth Image 2. • What is the most notable difference between the two images (Earth Image 1 and 2)? • Now look for more subtle differences. In which image can you see more land?
Earth Image 1 and 2 details • The Earth Image 1 • Visible image • The Earth Image 2 • Infrared image • This records "Heat Waves" and is able to penetrate clouds and haze much more easily. • Only one infrared wavelength was used in this image. Thus, it is only possible to show the image as shades of gray ranging from black to white. The Earth Image 1 The Earth Image 2
What I Learned (full version) • Describe something new that you learned about infrared. • Look back at your ideas in the “What I Know” section. • How many more things can you add? • Did any of your original ideas change?
Part 3—Viewing Earth from space using radar images • We’ve looked at a “data set” using visible energy and IR energy. • Now we'll take a look at images that use radar energy to give us a closer view of the earth • Brainstorm (10 min) • What I Know • Describe what you know about radar and radar imaging
Vocab Strategy: Kate Kinsella • Kate Kinsella • websites found at the end of the worksheet
Vocab • Electromagnetic Spectrum • The range of wavelengths or frequencies over which electromagnetic radiation extends. • Wavelength • the distance from one wave crest to the next wave crest • radar • Radio Detection and Ranging
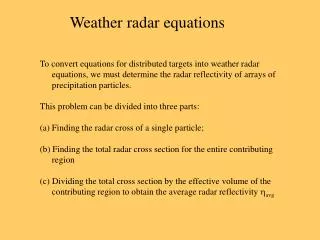
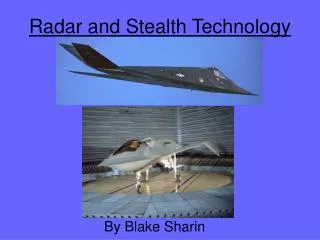
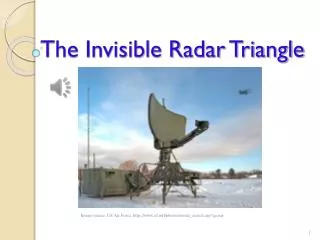
RADAR • Where does radar fall on the electromagnetic spectrum? • Microwave region of the spectrum (Mini-RF images at 4.2 and 13 cm wavelengths)
Background: Seasat • Launched in 1978 • Included an imaging radar • Its mission was to understand the physical processes taking place on the ocean surface through analysis of its radar images
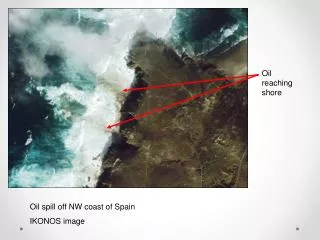
Background--Why radar? • The SEASAT radar images gave scientists an invaluable tool for looking at the Earth, over both ocean and land. • Since the radar instrument uses energy generated by the instrument itself, radar has capabilities that visible cameras do not: • radar imaging can produce images at night • radar has the capacity to transmit through even the heaviest cloud cover.
How does radar imaging work? • Since the radar impulses are sent at an angle toward the Earth's surface, flat surfaces such as streets, parking lots, and calm water reflect the energy away from the receiver, like so: • All of the structures generally appear as dark areas in radar images. • The angled roofs and uneven surfaces of vegetation and land surfaces tend to reflect a greater amount of energy back at the radar antenna and thus appear as lighter areas.
What I learned (full version) • What I learned about the radar energy • Describe something new that you learned about radar energy. • Look back at your ideas in the “What I Know” section. How many more things can you add? Did any of your ideas change?
Part 4: Radar Image Analysis • For this section, you will need the following images (in your teacher binder): LASESAT (1978) LASIRC image LAZoomIn (1978)
LASEASAT (1978) image Burbank • Look at the image labeled LASEASAT (1978). • This is an image of Los Angeles and the surrounding area as taken from the SEASAT satellite in 1978. • The image was taken from the West (to the left of the image) LASEASAT
LASEASAT (1978) image Burbank • Locate the city of Burbank. • Notice the darker area just underneath the white square. • These are the Hollywood Hills which reach towards the left (West) into the Santa Monica Mountains. • The famous HOLLYWOOD sign is located here. LASEASAT
Feature ID Burbank • List five features of the city that you can readily make out, such as streets and mountains. • Why does Burbank stand out as a white square? LASEASAT
What’s wrong with Burbank? • Burbank is unique in this image in that its streets are oriented differently from the remainder of the cities in Los Angeles. • The streets are lined up in such a way that the incoming radar pulses are able to bounce off the streets and then bounce again off the buildings (called a double-bounce) and directly back towards the radar instrument. • Dark = smooth surfaces • Light = rough/angled surfaces
LASEASAT (1978) image analysis • This image of Los Angeles and its surrounding cities was taken from the west (left on the image). • The Pacific Ocean is visible on the left of the radar image and the San Gabriel Mountains are clearly shown in the upper right corner. • The more impulses returning to the radar receiver, the lighter the image. LASEASAT
Image comparison Burbank Dodger Stadium • Now look at the LAZoomIn (1978) image. This image is a close up of downtown Los Angeles, with Dodger stadium featured at the top center. • What features can be identified in both the LASEASAT and LAZoomIn images? LAZoomIn (1978) LASEASAT (1978)
LAZoomIn (1978) image analysis LAZoomIn (1978) • This image is of Dodger Stadium and the surrounding L.A. community. • Downtown Los Angeles in the center of the image, ringed by freeways. • The stadium itself appears darker than the surrounding areas because the flat surfaces of the playing field and parking lots reflect the radar impulses away from the radar receiver. • The other image is a visible image. • Notice how the radar image looks different than the visible image Google Earth
Then and now… • Next, look at the LASIRC image. • This is a RADAR image of Los Angeles collected by an instrument called SIR-C radar in October 1994, 16 years after the SEASAT image. • This instrument flew on the space shuttle. • This is again a black-and white image of Los Angeles, taken using the same type of radar (same wavelength and polarization) as the one flown on SEASAT. LASIRC
Compare LASIRC with LASEASAT • LASEASAT and LASIRC were taken 16 years apart, but they were also taken at different angles. • SEASAT flew in a near-polar orbit, observing Los Angeles at it flew from South to North. • SIR-C flew in a different orbit, observing Los Angeles at it flew from almost South-East to almost North-West. • When you look at things from different directions they tend to appear different. LASIRC (1994) LASEASAT (1978)
Perspective • When radar energy “bounces” off certain objects, those objects may show up brighter or darker, depending upon the angle they bounce off the object. • Lets say for example, the radar signal bounces off a building, or a tree from one angle, scientists will get a specific view of that object, from a particular angle.
Wrap up • How can our view of the surface of a planet change, depending upon the type of imaging device being used? • What other places might we use radar images? • Mini-RF uses radar to make images , and the Magellan spacecraft looked “through” the thick clouds of Venus to map the surface. • What other kinds of features can scientists possibly see using radar? • Buried geologic features in desert regions, surface features below thick vegetation (that is how scientists were able to uncover extensive surface features of the ancient civilization of the Mayans beneath the thick jungle cover.)