Understanding Ozone Levels and Aerosol Effects on U.S. Air Quality
This study explores the impact of nitrogen oxides (NOx) and hydrocarbon emissions on ozone levels, using the EKMA diagram for analysis. It highlights how increased NOx emissions correlate with potential ozone pollution in urban areas, suggesting a U.S. city that could represent these conditions. The analysis discusses the independence of ozone production rates from hydrocarbon concentrations in NOx-limited regimes, the role of PAN formation in ozone production, and the health effects of particulate matter (PM). The findings contribute to understanding air quality trends and regulations.

Understanding Ozone Levels and Aerosol Effects on U.S. Air Quality
E N D
Presentation Transcript
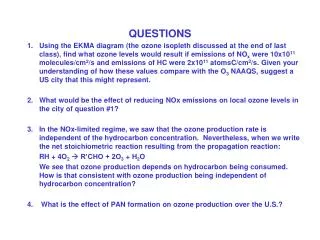
QUESTIONS • Using the EKMA diagram (the ozone isopleth discussed at the end of last class), find what ozone levels would result if emissions of NOx were 10x1011 molecules/cm2/s and emissions of HC were 2x10¹¹atomsC/cm2/s. Given your understanding of how these values compare with the O3 NAAQS, suggest a US city that this might represent. • What would be the effect of reducing NOx emissions on local ozone levels in the city of question #1? • In the NOx-limited regime, we saw that the ozone production rate is independent of the hydrocarbon concentration. Nevertheless, when we write the net stoichiometric reaction resulting from the propagation reaction: RH + 4O2 R’CHO + 2O3 + H2O We see that ozone production depends on hydrocarbon being consumed. How is that consistent with ozone production being independent of hydrocarbon concentration? 4. What is the effect of PAN formation on ozone production over the U.S.?
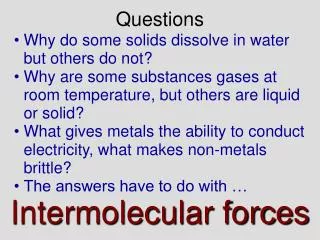
ORIGIN OF THE ATMOSPHERIC AEROSOL Aerosol: dispersed condensed phases suspended in a gas Size range: 0.001 mm (molecular cluster) to 100 mm (small raindrop) Soil dust Sea salt Environmental importance: health (respiration), visibility, climate, cloud formation, heterogeneous reactions, long-range transport of nutrients…
FINE PARTICLE GROWTH AT BLODGETT FOREST “Banana Plot” [Lunden et al., 2006]
ADVERSE HEALTH EFFECTS OF PM • Epidemiological studies show that PM: • affects cardiorespiratory system • can cause cancer • impairs lung development [NARSTO, 2003] The EPA estimates that over 35,000 premature deaths per year can be attributed to PM. More deadly than car accidents!
AIR POLLUTANTION IN THE U.S. 75 ppb (new standard, set in 2008) 50 mg m-3 (annual), 150 (daily) 15 mg m-3 (annual), 35 (daily) PM2.5 ≡ Particulate Matter (aerosols) less than 2.5 mm diameter
PARTICULATE MATTER (PM) CONCENTRATIONS AT U.S. SITES, 2008 Our National Air, EPA Report, 2008 PM2.5 (particles < 2.5 mm) PM10 (particles < 10 mm) Yellow and red sites are in violation of national air quality standard: 150 mg m-3 for daily PM10 15 mg m-3 for annual PM2.5 Modest decline in PM2.5 over last decade (< 20%)
Annual mean PM2.5 concentrations (NARSTO, 2004) FINE AEROSOL COMPOSITION IN NORTH AMERICA
TYPICAL AEROSOL SIZE DISTRIBUTION ultrafine fine coarse accumulation N=number concentration (particles/cm3) PM2.5 PM10
WHY SIZE MATTERS (1) Toxicity (2) Light Scattering (3) Particle Lifetime =550 nm [Seinfeld & Pandis] [Finlayson-Pitts & Pitts] [NARSTO, 2003] (4) Surface Reactions: smaller particles have greater relative surface area
8 ug/m3 12 July AEROSOLS AND VISIBILITY:PM10 IN BEIJING 2008 WHO Guideline: 50 ug/m3 averaged over 24 hrs 32 ug/m3 20 July 26 ug/m315 July 104 ug/m3 5 August 191 ug/m3 7 August 278 ug/m3 10 August http://news.bbc.co.uk/2/hi/in_pictures/7506925.stm
7.6 µgm-3 12.0 µgm-3 65.3 µgm-3 21.7 µgm-3 (previous) U.S. air quality standard EPA REGIONAL HAZE RULE: WILDERNESS AREAS MUST ACHIEVE NATURAL VISIBILITY CONDITIONS BY 2064 Visibility degradation by aerosols at Glacier National Park, Montana Glacier National Park Natural aerosol concentrations are typically less than 2 mg m-3
Statistics for 20% worst visibility days Background; includes transboundary pollution 2001 observations Natural Deciviews 300 150 80 40 20 Visual range (km) VISIBILITY IN U.S. WILDERNESS AREAS deciviews: dv = 10ln(bext/10)
PROGRESS TOWARDS REGIONAL HAZE RULE Shenandoah National Park [EPA Report, Visibility, 2008]
ANNUAL MEAN PM2.5 CONCENTRATIONS (2002)derived from MODIS satellite instrument data 0.47 mm 0.65 mm 2.13 mm AEROSOL SURFACE
DUST: MOST IMPORTANT(?) NATURALLY EMITTED AEROSOL Sources: arid / semi-arid regions Emission in both fine and coarse mode, depends on surface properties and wind speed. Resulting lifetime ~weeks Dust Emissions (2001) g m-2 y-1 [Fairlie et al. 2007] [Husar et al., 2002]
MEAN SEA SALT AEROSOL CONCENTRATIONS Lower marine boundary layer (0-100 m) [Alexander et al. 2005]
ELEMENTAL CARBON (EC) ORGANIC CARBON (OC) CARBONACEOUS AEROSOL SOURCES GLOBAL 22 Tg yr-1 130 Tg yr-1 = BSOA UNITED STATES 0.66 Tg yr-1 2.7 Tg yr-1
BLACK CARBON EMISSIONS DIESEL DOMESTIC COAL BURNING BIOMASS BURNING
S. California fire plumes, Oct. 25 2004 WILDFIRES: A GROWING AEROSOL SOURCE Total carbonaceous (TC) aerosol averaged over U.S. IMPROVE sites Interannual variability is driven by wildfires
SECONDARY ORGANIC AEROSOL PRODUCTION FROM BIOGENIC VOC EMISSIONS Biogenic VOC Emissions Nucleation (oxidation products) Oxidation Reactions (OH, O3,NO3) Growth Condensation on pre-existing aerosol Over 500 reactions to describe the formation of SOA precursors, ozone, and other photochemical pollutants [Griffin et al., 2002; Griffin et al., 2005; Chen and Griffin, 2005]
BIOGENIC HYDROCARBONS Anthropogenic SOA-precursors = aromatics (emissions are 10x smaller) "Trees cause more pollution than automobiles do.“ (when talking about ozone in 1981) Isoprene (C5H8) Monoterpenes(C10H16) Sesquiterpenes (C15H24)
PRIMARY BIOLOGICAL AEROSOL PARTICLES (PBAP) ALGAE VIRUSES BACTERIA POLLEN FUNGUS Very large and likely short-lived PLANT DEBRIS These particles have not traditionally been considered part of the OA budget, but this has been revised in recent years. Not much is known about emissions, processing, climate effects.