
Uploaded by
genica
1 SLIDES
120 VUES
10LIKES
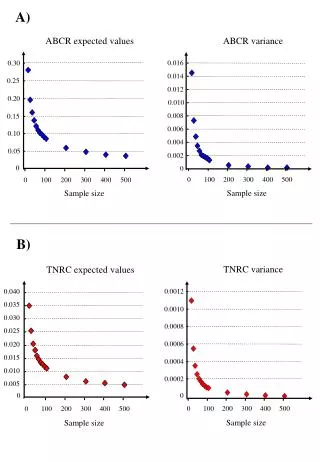
Statistical Analysis of Expected Values and Variances
DESCRIPTION
Explore ABCR and TNRC expected values and variances with sample sizes, comparing 8 data points each.
Download
1 / 1
Télécharger la présentation 
Statistical Analysis of Expected Values and Variances
An Image/Link below is provided (as is) to download presentation
Download Policy: Content on the Website is provided to you AS IS for your information and personal use and may not be sold / licensed / shared on other websites without getting consent from its author.
Content is provided to you AS IS for your information and personal use only.
Download presentation by click this link.
While downloading, if for some reason you are not able to download a presentation, the publisher may have deleted the file from their server.
During download, if you can't get a presentation, the file might be deleted by the publisher.
E N D
Presentation Transcript
A) ABCR expected values ABCR variance 0.016 0.30 0.014 0.25 0.012 0.20 0.010 0.008 0.15 0.006 0.10 0.004 0.05 0.002 0 0 0 100 200 300 400 500 0 100 200 300 400 500 Sample size Sample size B) TNRC variance TNRC expected values 0.0012 0.040 0.035 0.0010 0.030 0.0008 0.025 0.0006 0.020 0.015 0.0004 0.010 0.0002 0.005 0 0 0 100 200 300 400 500 0 100 200 300 400 500 Sample size Sample size


More Related