Avoiding bleed-through artifacts on the confocal microscope
230 likes | 265 Vues
Learn about avoiding bleed-through artifacts when using fluorescent dyes on a confocal microscope. This guide explains the complexities of dye responses to light, and how overlapping emission curves can affect imaging and co-localization. Discover practical solutions using sequential image acquisition techniques to prevent artifacts and enhance image quality.

Avoiding bleed-through artifacts on the confocal microscope
E N D
Presentation Transcript
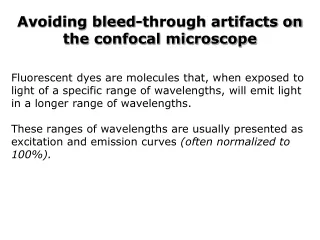
Avoiding bleed-through artifacts on the confocal microscope Fluorescent dyes are molecules that, when exposed to light of a specific range of wavelengths, will emit light in a longer range of wavelengths. These ranges of wavelengths are usually presented as excitation and emission curves (often normalized to 100%).
Avoiding bleed-through artifacts on the confocal microscope Product inserts will frequently provide excitation and emission maxima as single wavelengths for simplicity’s sake, but the responses of the dyes to light are much more complicated.
This graph shows the excitation curves of two popular fluorescent dyes that have emission curves that are similar to the well-known dyes Fluorescein and Texas Red.
Overlaid on the excitation curves are the wavelengths of two of the confocal microscope’s lasers, 488nm and 543nm.
You will note that the laser wavelengths do not actually coincide with the peak excitation of the dyes. This will be important later.
This graph shows the emission curves of the two fluorescent dyes. Since they are commonly portrayed as green and red fluorescence, we’ve used those colors here.
Note how much the emission curve from the green dye overlaps that of the red dye. This is portrayed in yellow because green + red = yellow.
This overlap of the two emission curves is what can create the appearance of co-localization if the dyes are imaged simultaneously on the confocal.
Since the green dye was excited at approximately 60% of maximum and the red dye was excited at 35% of maximum, the emission curves actually look more like this…
You can see that this makes the yellow overlap region an even more significant issue.
Confocal microscopes use photomultiplier tubes (PMT) to detect light. Because PMTs only detect photons (regardless of color), the confocal uses filters to select the range of light that each detector “sees”. PMT #1 PMT #2
The gray overlay shows the light that is blocked by the filters. If the confocal is set up to simultaneously excite and image these two dyes, a problem occurs. PMT #1 PMT #2
In this example, PMT #1 will see the green fluorescence. PMT #2 will see the red fluorescence and a portion of the spectra from the green fluorescence (shown as yellow). PMT #1 PMT #2
When the two images are overlaid, it will appear as if the green and some of the red staining are co-localized. This is due to the artifact of the green fluorescence being detected in the red channel (PMT #2). PMT #1 PMT #2
There is a simple way to avoid this artifact… PMT #1 PMT #2
Acquire the images sequentially, using the 488nm laser and PMT #1 to acquire the image of the green fluorescence. PMT #1 PMT #2
Then acquire the image of the red fluorescence, using the 543nm laser and PMT #2. It is very important that the 488nm laser be turned off during this step. PMT #1 PMT #2
Without the 488nm laser, there is no excitation of the green dye and there is no bleed-through into PMT #2. This means that the only light that PMT #2 sees is from the red dye. PMT #1 PMT #2
Confocal microscopes make solving this problem fairly easy, since the lasers can be turned on and off as needed. If you are using a standard epifluorescence microscope with a CCD camera; you will also need to be careful about bleed-through. Multiple wavelength filter cubes can have significant bleed-through artifacts. Acquiring images of each of the fluorescent dyes with a single wavelength cube will lessen this problem, but may not completely eliminate it. This is because the light source is continuously emitting all wavelengths and fluorescence filters are not perfect. An alternative is to use two dyes that do not overlap, such as fluorescein (or a similar green dye) and CY5 (a far-red emitting dye).
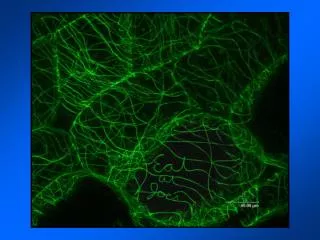
Example CH 2 – “red” CH 1 – “green” Using the 488 nm laser only, but looking at both the green and red channels, here is what you’d see… Remember that the image is of light intensities (greyscale), the colors are added for our benefit. See the “ghost image” of the green channel appearing in the red channel, that’s bleedthrough. Using the 543 nm laser only, but looking at both the green and red channels, here is what you’d see… Note that there is no bleedthrough from the red channel into the green channel. Bleedthrough almost always is from the shorter wavelength (blue end of the spectrum) into the longer wavelength (redder end of the spectrum).
Example CH 2 – “red” CH 1 – “green” Here would be an example of what you might see if you acquired both channels simultaneously. The red channel shows some bleedthrough of the green channel image (contrast it with the image below). Again, using the 543 nm laser only, but looking at both the green and red channels, here is what you’d see… Contrast this red image with the one above. No bleedthrough here…
Example Both channels combined This image is an example of a simultaneous acquisition. The green image is bleeding through into the red, so the two images combined shows a greenish-yellow color in the mitochondria. This image is an example of a sequential acquisition, one channel, then the other, so that bleedthrough doesn’t happen. Notice that the mitochondria are a true green color.