Download
1 / 42
490 likes | 716 Vues
Learn about utility, total utility, marginal utility, maximizing total utility, budget allocation, and demand curve through examples and practical steps in this detailed guide.

E N D
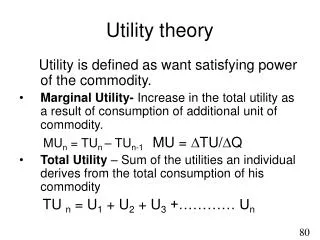
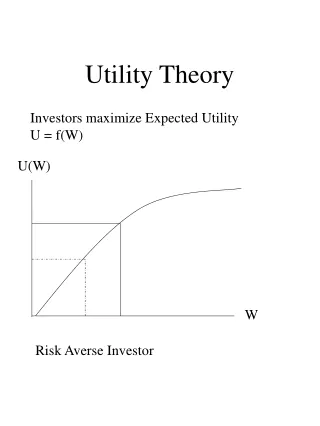
MARGINAL UTILITY THEORY • Utility • Utility is the benefit or satisfaction that a person gets from the consumption of a good or service.
MARGINAL UTILITY THEORY • Total Utility • Total utility is the total benefit that a person gets from the consumption of a good or service. Total utility generally increases as the quantity consumed of a good increases. • Table 11.1 shows an example of total utility from bottled water and chewing gum.
MARGINAL UTILITY THEORY • Marginal Utility • Marginal utility is the change in total utility that results from a one-unit increase in the quantity of a good consumed. • To calculate marginal utility, we use the total utility numbers in Table 11.1.
MARGINAL UTILITY THEORY • The marginal utility of the 3rd bottle of water = 36 units – 27 units = 9 units.
MARGINAL UTILITY THEORY • The marginal utility of the 3rd bottle of water = 36 units – 27 units = 9 units.
MARGINAL UTILITY THEORY • Diminishing marginal utility • We call the general tendency for marginal utility to decrease as the quantity of a good consumed increases the principle of diminishing marginal utility. • Think about your own marginal utility from the things that you consume. • The numbers in Table 11.1 display diminishing marginal utility.
MARGINAL UTILITY THEORY Figure 11.5 shows total utility and marginal utility. Part (a) graphs Tina’s total utility from bottled water. Each bar shows the extra total utility she gains from each additional bottle of water—her marginal utility. The blue line is Tina’s total utility curve.
MARGINAL UTILITY THEORY Part (b) shows how Tina’s marginal utility from bottled water diminishes by placing the bars shown in part (a) side by side as a series of declining steps. The downward sloping blue line is Tina’s marginal utility curve.
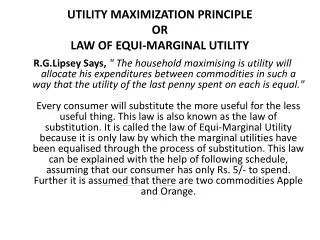
MARGINAL UTILITY THEORY • Maximizing Total Utility • The goal of a consumer is to allocate the available budget in a way that maximizes total utility. • The consumer achieves this goal by choosing the point on the budget line at which the sumof the utilities obtained from all goods is as large as possible.
MARGINAL UTILITY THEORY This outcome occurs when a person follows the utility-maximizing rule: • 1. Allocate the entire available budget. • 2. Make the marginal utility per dollar spent the same for all goods.
MARGINAL UTILITY THEORY • Allocate the Available Budget • The available budget is the amount available after choosing how much to save and how much to spend on other items. • The saving decision and all other spending decisions are based on the same utility maximizing rule that you are learning here and applying to Tina’s decision about how to allocate a given budget to water and gum.
MARGINAL UTILITY THEORY • Equalize the Marginal Utility Per Dollar Spent • Spending the entire available budget doesn’t automatically maximize utility. • Dollars might be misallocated—spend in ways that don’t maximize utility. • Making the marginal utility per dollar spent the same for all goods gets the most out of a budget.
MARGINAL UTILITY THEORY • Step 1: Make a table that shows the quantities of the two goods that just use all the budget.
MARGINAL UTILITY THEORY • Step 2: Calculate the marginal utility per dollar spent on the two goods. • Marginal utility per dollar spent • The increase in total utility that comes from the last dollar spent on a good.
MARGINAL UTILITY THEORY • Step 3: Make a table that shows the marginal utility per dollar spent on the two goods for each affordable combination.
MARGINAL UTILITY THEORY • Row C maximizes utility. The marginal utility per dollar spent is equal for the two goods.
MARGINAL UTILITY THEORY • Units of Utility • In calculating Tina’s utility-maximizing choice in Table 11.3, we have not used the concept of total utility. • All our calculations use marginal utility and price. • Changing the units of utility doesn’t affect our prediction about the consumption choice that maximizes total utility.
MARGINAL UTILITY THEORY • Finding the Demand Curve • We can use marginal utility theory to find a consumer’s demand curve. • Figure 11.6 shows Tina’s demand curve for bottled water.
MARGINAL UTILITY THEORY When the price of water is $1 a bottle, Tina buys 2 bottles of water a day. She is at point A on her demand curve for water. When the price of water falls to 50¢ , Tina buys 4 bottles of water a day and moves to point B on her demand curve for bottled water.
MARGINAL UTILITY THEORY • Marginal Utility and the Elasticity of Demand • If, as the quantity consumed of a good increases, marginal utility decreases quickly, the demand for the good is inelastic. • The reason is that for a given change in the price, only a small change in the quantity consumed of the good is needed to bring its marginal utility per dollar spent back to equality with that on all the other items in the consumer’s budget.
MARGINAL UTILITY THEORY • But if, as the quantity consumed of a good increases, marginal utility decreases slowly, the demand for that good is elastic. • In this case, for a given change in the price, a large change in the quantity consumed of the good is needed to bring its marginal utility per dollar spent back to equality with that on all the other items in the consumer’s budget.
MARGINAL UTILITY THEORY • The Power of Marginal Analysis • The rule to follow is simple: • If the marginal utility per dollar spent on water exceeds the marginal utility per dollar spent on gum, buy more water and less gum. • If the marginal utility per dollar spent on gum exceeds the marginal utility per dollar spent on water, buy more gum and less water. • More generally, if the marginal gain from an action exceeds the marginal loss, take the action.
EFFICIENCY, PRICE, AND VALUE • Consumer Efficiency • When a consumer maximizes utility, the consumer is using her or his resources efficiently. • Using what you’ve learned, you can now give the concept of marginal benefit a deeper meaning. • Marginal benefit is the maximum price a consumer is willing to pay for an extra unit of a good or service when total utility is maximized.
EFFICIENCY, PRICE, AND VALUE • The Paradox of Value • For centuries, philosophers have been puzzled by the fact that water is vital for life but cheap while diamonds are used only for decoration yet are very expensive. • You can solve this puzzle by distinguishing between total utility and marginal utility. • Total utility tells us about relative value; marginal utility tells us about relative price.
EFFICIENCY, PRICE, AND VALUE • When the high marginal utility of diamonds is divided by the high price of a diamond, the result is a number that equals the low marginal utility of water divided by the low price of water. • The marginal utility per dollar spent is the same for diamonds as for water. • Consumer Surplus • Consumer surplus measures value in excess of the amount paid.
EFFICIENCY, PRICE, AND VALUE Figure 11.7 shows the paradox of value. The demand curve D shows the demand for water. The demand curve and the supply curve S determine the price of water at PW and the quantity at QW. The consumer surplus from water is the large green triangle.
EFFICIENCY, PRICE, AND VALUE In this figure, the demand curve D is the demand for diamonds. The demand curve and the supply curve S determine the price of a diamond at PD and the quantity at QD. The consumer surplus from diamonds is the small green triangle.
Prepared by William C. Schaniel Professor of Economics Department of Economics State University of West Georgia Carrollton, Georgia