Understanding Heating Curves: Phase Changes and Heat Capacity in Substances
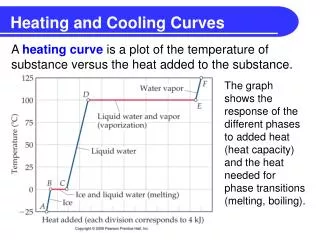
Heating curves illustrate the temperature changes and energy transformations that occur as a substance transitions between different phases: solid, liquid, and gas. This process involves kinetic energy (KE) changes during temperature variations and potential energy (PE) changes during phase transitions. Specific heat, heat of fusion, and heat of vaporization play critical roles, dictating how much energy is needed for each phase change. For instance, the heat of fusion for ice is 6.009 kJ/mol, while the heat of vaporization for water is 40.79 kJ/mol, highlighting their differences and relevance in everyday phenomena such as sweating and steam burns.

Understanding Heating Curves: Phase Changes and Heat Capacity in Substances
E N D
Presentation Transcript
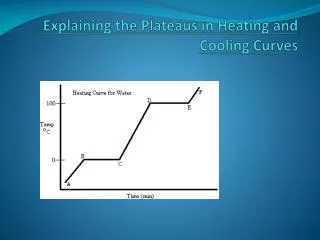
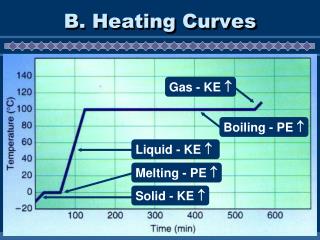
Gas - KE Boiling - PE Liquid - KE Melting - PE Solid - KE B. Heating Curves
B. Heating Curves • Temperature Change • change in KE (molecular motion) • depends on heat capacity • Heat Capacity • energy required to raise the temp of 1 gram of a substance by 1°C • Specific heat - different values for each substance
B. Heating Curves • Phase Change • change in PE (molecular arrangement) • temp remains constant • Heat of Fusion (Hfus) • energy required to melt 1 gram of a substance at its m.p. • Hfus of ice = 6.009 kJ/mol
B. Heating Curves • Heat of Vaporization (Hvap) • energy required to boil 1 gram of a substance at its b.p. • Hvap for water = 40.79 kJ/mol • usually larger than Hfus…why? • EX: sweating, steam burns