Watershed Mercury Processes
140 likes | 275 Vues
This overview explores the complex dynamics of mercury in aquatic systems, focusing on natural and anthropogenic sources, including emissions, wet and dry deposition, litterfall, and their impact on water bodies. We delve into key processes such as methylation, demethylation, and transformations within the water column and sediments. Understanding the role of mercury in the food web, including its bioaccumulation in predator fish like yellow perch, is crucial for addressing ecological and health impacts. This synthesis aims to inform monitoring and management strategies for mercury in aquatic ecosystems.

Watershed Mercury Processes
E N D
Presentation Transcript
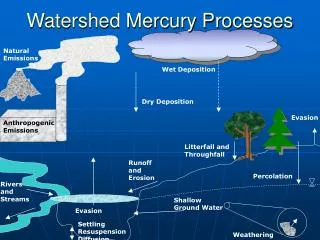
Watershed Mercury Processes Natural Emissions Wet Deposition Dry Deposition Evasion Anthropogenic Emissions Litterfall and Throughfall Runoff and Erosion Percolation Rivers and Streams Shallow Ground Water Evasion Settling Resuspension Diffusion Weathering
Predator Fish: Yellow Perch Phytoplankton MeHg Zooplankton Prey Fish: Yellow Perch Benthos Mercury in the Food Web Images from: www.glerl.noaa.gov/pubs/photogallery/gallery.html, www.dnr.state.wi.us
Overview of WASP Mercury Module Point Source Loads of Hg(II) Watershed and Atmospheric Loads of Hg(II) and MeHg Volatile Exchange of Hg(0) State Variables Hg(0) Silt Hg(II) Sand MeHg Demethylation Oxidation DOC Methylation Reduction Burial
Mercury Processes in WASP • Partitioning • Transport • Volatilization of Hg0(aq) to Hg0(air) • Transformation • Oxidation: Hg0 HgII • Reduction: HgII Hg0 • Methylation: HgII MeHg • Demethylation: MeHg HgII • Photoreduction: MeHg Hg0
Mercury Partitioning Processes Parameters: Enter Dissolved Organic Carbon Concentration Example Ranges: Oligotrophic Lake: <1 – 3 mg/L Mesotrophic Lake: <1 – 5 mg/L Eutrophic Lake: 5 – 30 mg/L Dystrophic Lake: 3 – 30 mg/L from Wetzel, 2001.
Hg0 Volatilization • Hg(0)diss to gaseous Hg(0) • Constants: • Set volatilization option • (1 to 5), • Henry’s Law constant • (e.g., 7.1e-3 atm/M) • Atmospheric concentration • (e.g., 1.6e-9 g/m3)
Hg0 Oxidation • Oxidation: Hg(0) to Hg(II) • Hg0 Constants: • Set phase switches (1 for dissolved) • Yield coefficient (1.0) • Parameters: • Rate constants for water column segments • (e.g., 1e-2 to 1e-3 day-1)
HgII Transformation Processes • Reduction: HgII to Hg(0) • HgII Constants: • Set photolysis option (2), • Quantum yield coefficients (1 for diss, sorb), • Yield coefficient (1.0), • Surface rate constant (e.g., 1e-3 to 1e-1) • Parameters: • Light attenuation coefficients for water column segments • (e.g., 0.5-2 m-1)
HgII Transformation Processes • Methylation: HgII to MeHg • Constants: • Set phase switches (1 for diss, sorb), • Temperature correction factors (2.0 per 10 C change), • Yield coefficient (1.07) • Parameters: • Methylation rate constants for water column and benthic segments • (e.g., 1e-5 to 1e-2 day-1)
MeHg Transformation Processes • Photoreduction: MeHg to Hg(0) • MeHg Constants: • Set photolysis option (2), • Quantum yield coefficients (1 for diss, sorb), • Yield coefficient (0.93), • Surface rate constant (e.g., 1e-3 to 1e-1) • Parameters: • Enter light attenuation coefficients for water column segments • (e.g., 0.5-2 m-1)
MeHg Transformation Processes • Bacterial Demethylation: MeHg to HgII • Constants: • Set phase switches (1 for diss, sorb), • Temperature correction factors (10 kcal/mole), • Yield coefficient (0.93) • Parameters: • Enter demethylation rate constants for benthic segments (e.g., 1e-5 to 1e-2 day-1)
Atmospheric Wet and Dry Deposition reduction, evasion Water Surface Impervious Surface HgII in Soil export Leaching runoff reduction, volatilization runoff and erosion Tributaries volatilization WCS Watershed Model MeHg Hg(II)Hg0 Silt water column Sand export MDS Tributary Model export sedimentlayer Wasp5/6 Water Body Model Burial
Atmospheric Deposition 12 (wet), 6 (dry) μg/m2-yr 95 % 3.4 % 1.3 % 0.2 % Water Surface 12 μg/m2-yr Impervious Surface Soil 74 μg/kg 0.2 μg/m2-yr 0.6 μg/m2-yr 0.4 μg/m2-yr 1.3 μg/m2-yr Tributaries < 0.1 μg/m2-yr 1.7 μg/m2-yr River 5 – 6 ng/L water column 1.7 μg/m2-yr sedimentlayer 10 - 13 μg/kg