4-1 Organizing Data Into Matrices
4-1 Organizing Data Into Matrices. Objectives : To identify matrices and their elements To organize into matrices. Objectives. Identifying Matrices Organizing Statistical Data. Vocabulary. A matrix is a rectangular array of numbers written brackets. 3 Columns. Name of the Matrix

4-1 Organizing Data Into Matrices
E N D
Presentation Transcript
4-1 Organizing Data Into Matrices Objectives : To identify matrices and their elements To organize into matrices
Objectives Identifying Matrices Organizing Statistical Data
Vocabulary A matrix is a rectangular array of numbers written brackets. 3 Columns Name of the Matrix (represented with a capital letter) 2 Rows Dimensions - Matrix A is a 2 x 3 matrix
Writing the Dimensions of a Matrix Write the dimensions of each matrix. 7 –4 12 9 The matrix has 2 rows and 2 columns and is therefore a 2 2 matrix. a. The matrix has 1 row and 3 columns and is therefore a 1 3 matrix. b. 0 6 15 Do Quick Check #1 (all) on Page 168
Vocabulary Each number in a matrix is a matrix element. You can identify a matrix element by its position within the matrix. Use a lowercase letter with subscripts. The subscripts represent the element’s row number and column number.
3 –1 –8 5 1 8 4 9 8 –4 7 –5 3 –1 –8 5 1 8 4 9 8 –4 7 –5 a. K = b. K = k12 is the element in the first row and second column. k32 is the element in the third row and second column. Identifying a Matrix Element Identify each matrix element. 3 –1 –8 5 1 8 4 9 8 –4 7 –5 K = a.k12 b.k32 c.k23 d.k34 Element k12 is –1. Element k32 is –4.
3 –1 –8 5 1 8 4 9 8 –4 7 –5 3 –1 –8 5 1 8 4 9 8 –4 7 –5 c. K = d. K = k23 is the element in the second row and third column. k34 is the element in the third row and the fourth column. Continued (continued) 3 –1 –8 5 1 8 4 9 8 –4 7 –5 K = a.k12 b.k32 c.k23 d.k34 Element k23 is 4. Element k34 is –5. Do Quick Check #2 (all) on Page 169
Ed X X Jo X Lew X X X X Ed Jo Lew Wins Losses 5 6 3 2 1 4 Real World Example Three students kept track of the games they won and lost in a chess competition. They showed their results in a chart. Write a 2 3 matrix to show the data. = Win X = Loss Let each row represent the number of wins and losses and each column represent a student.
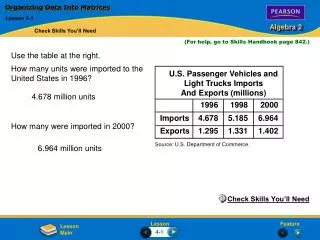
Each column represents a different year. 1996 1998 2000 N = Import Exports 4.678 5.185 6.964 1.295 1.331 1.402 Each row represents imports and exports. Real World Example Refer to the table. U.S. Passenger Car Imports And Exports (millions) 199619982000 Imports 4.678 5.185 6.964 Exports 1.295 1.331 1.402 a. Write a matrix N to represent the information. Use 2 3 matrix. Source: U.S. Department of Commerce.
Continued (continued) U.S. Passenger Car Imports And Exports (millions) 199619982000 Imports 4.678 5.185 6.964 Exports 1.295 1.331 1.402 b. Which element represents exports for 2000? Source: U.S. Department of Commerce. Exports are in the second row. The year 2000 is in the third column. Element n23 represents the number of exports for 2000.