4.1 Organizing Data Into Matrices
4.1 Organizing Data Into Matrices. Organizing Statistical Data …it’s almost November …you should know by now your book comes with you to class EVERYDAY. 2) Organizing Statistical Data. A matrix is an easy way to organize large amounts of data. 2) Organizing Statistical Data.

4.1 Organizing Data Into Matrices
E N D
Presentation Transcript
4.1 Organizing Data Into Matrices Organizing Statistical Data …it’s almost November…you should know by now your book comes with you to class EVERYDAY
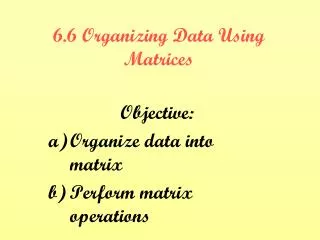
2) Organizing Statistical Data A matrix is an easy way to organize large amounts of data.
2) Organizing Statistical Data A matrix is an easy way to organize large amounts of data. Number of Box-office Sequels Gross Star Wars 3 $1,491.4 James Bond 19 $1,056.0 Jurassic Park 3 $767.4 Star Trek 9 $715.2 Batman 4 $705.3
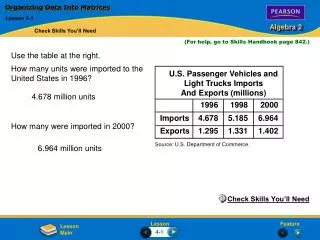
Example 3, p.169 • Rewrite the matrix as a 2x3 matrix. Label the rows and columns.
Example 3, p.169 • Rewrite the matrix as a 2x3 matrix. Label the rows and columns. China Russia United States production 42 46 71 consumption 43 28 98
Example 3, p.169 • How could you modify your matrix to include data from other countries?
Example 3, p.169 • How could you modify your matrix to include data from other countries? Add a new column for each additional country.
Example 4, p.170 • Write a matrix M to represent the information from the table below.
Example 4, p.170 • Write a matrix M to represent the information from the table below. Floor Pommel Still Vault Parallel Horizontal Exercise Horse Rings Bars Bars Paul Hamm9.725 9.700 9.587 9.137 9.837 9.837 Dae Eun Kim 9.650 9.537 9.712 9.412 9.775 9.725 Tae-Young Yang 9.512 9.650 9.725 9.700 9.712 9.475
Example 4, p.170 • Identify element m15. What does this element represent?
Example 4, p.170 • Identify element m15. What does this element represent? Floor Pommel Still Vault Parallel Horizontal Exercise Horse Rings Bars Bars Paul Hamm9.725 9.700 9.587 9.137 9.837 9.837 Dae Eun Kim 9.650 9.537 9.712 9.412 9.775 9.725 Tae-Young Yang 9.512 9.650 9.725 9.700 9.712 9.475
Example 4, p.170 • Identify element m15. What does this element represent? Floor Pommel Still Vault Parallel Horizontal Exercise Horse Rings Bars Bars Paul Hamm9.725 9.700 9.587 9.137 9.837 9.837 Dae Eun Kim 9.650 9.537 9.712 9.412 9.775 9.725 Tae-Young Yang 9.512 9.650 9.725 9.700 9.712 9.475
Example 4, p.170 • Identify element m15. What does this element represent? Floor Pommel Still Vault Parallel Horizontal Exercise Horse Rings Bars Bars Paul Hamm9.725 9.700 9.587 9.137 9.837 9.837 Dae Eun Kim 9.650 9.537 9.712 9.412 9.775 9.725 Tae-Young Yang 9.512 9.650 9.725 9.700 9.712 9.475 9.837; Paul Hamm’s score on the parallel bars.
Homework p.171 #12-18, 26, 28 QUIZ – Friday October 30 Section 4.1 …writing dimensions of a matrix …identifying matrix elements …creating matrices from statistical data
Homework Solutions 14b) 24; percent of suburban libraries offering parenting skills programs 15) 3.3; number of DVD’s, in millions, shipped in 2000 • 881.9; number of CD’s, in millions, shipped in 2001 18) The student identified data in column 3, row 2 when he or she should have looked at row 3, column 2.