GrADS Station Data Model for In-situ Observations
Explore how GrADS facilitates visualization, analysis, and output options for in-situ observational data. Utilize metadata like station ID, coordinates, and time to create detailed reports. Generate images, ASCII, binary, or GIS formats for comprehensive data analysis.

GrADS Station Data Model for In-situ Observations
E N D
Presentation Transcript
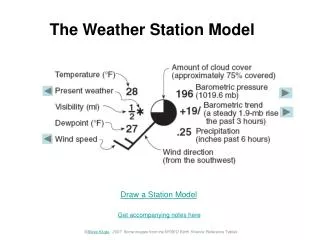
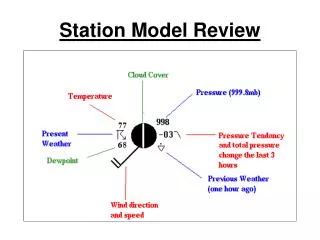
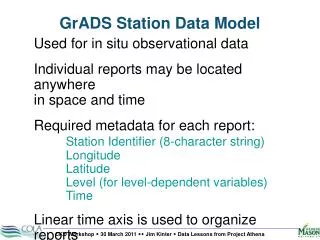
GrADS Station Data Model Used for in situ observational data Individual reports may be located anywhere in space and time Required metadata for each report: Station Identifier (8-character string) Longitude Latitude Level (for level-dependent variables) Time Linear time axis is used to organize reports
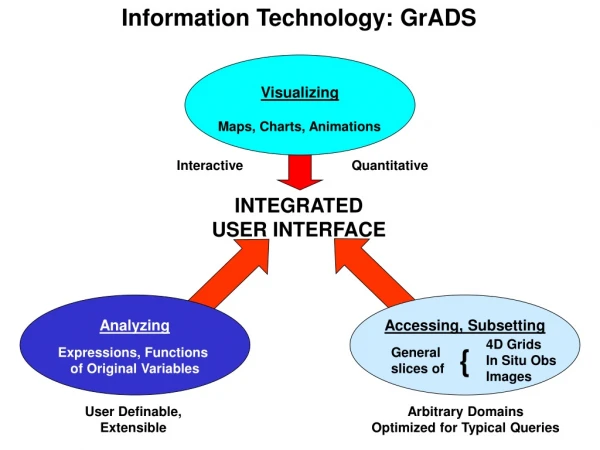
Visualization in GrADS Display options include:Contour (lines or shaded) Grid fill (colors or numbers) Bar graph (with error bars) Scatter plot Winds: Vectors, Barbs, or Streamlines Output options include:Images Vector Graphics (e.g. Postscript) ASCII Binary or NetCDF file GIS-Compatible Formats new!
Data Analysis in GrADS GrADS expressions are formulas that contain:Operands (variables, functions, or constants)Operators (add, subtract, multiply, divide)Parentheses (to control the order of operation) Expression handling is recursive, so an expression may be embedded within another. Some examples: temp*9/5+32 aave((temp*9/5+32),global) hgt(lev=500)-hgt(lev=1000) ave(uwnd,lon=0,lon=360) sum(precip,t+0,t+24)
QuikSCAT Winds (HDF), Surface Obs (BUFR), and ETA Model SLP (GRIB) 00z 6 Dec 2003
Analysis of Surface METAR Observations with Radar 18z 29 May 2009