
Uploaded by
halden
4 SLIDES
181 VUES
40LIKES
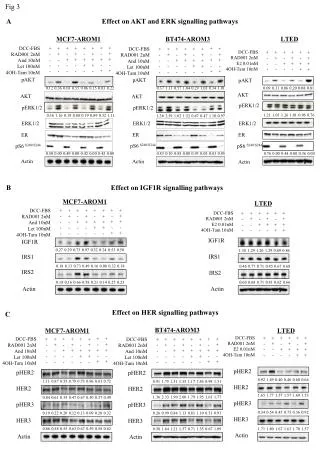
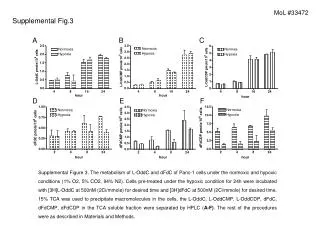
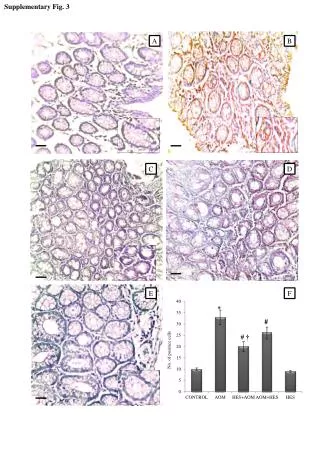
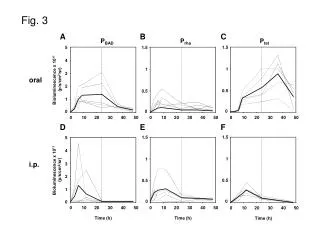
Enhanced Visualization Techniques in Scientific Research: A Case Study
DESCRIPTION
This study explores advanced visualization techniques presented in Figures 3 to 6, illustrating their effectiveness in interpreting complex data sets. Each figure highlights a unique method of data representation, aiding in clearer understanding and analysis. Figures 3 and 4 focus on innovative graphing techniques, while Figures 5 and 6 delve into interactive data visualizations. The findings demonstrate how these methods can significantly enhance data interpretation and decision-making in various scientific disciplines.
Download
1 / 4
Télécharger la présentation 
Enhanced Visualization Techniques in Scientific Research: A Case Study
An Image/Link below is provided (as is) to download presentation
Download Policy: Content on the Website is provided to you AS IS for your information and personal use and may not be sold / licensed / shared on other websites without getting consent from its author.
Content is provided to you AS IS for your information and personal use only.
Download presentation by click this link.
While downloading, if for some reason you are not able to download a presentation, the publisher may have deleted the file from their server.
During download, if you can't get a presentation, the file might be deleted by the publisher.
E N D


More Related