Super-Resolution Optical Microscopy
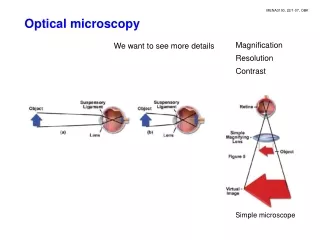
Super-Resolution Optical Microscopy. Bo Huang Light Microscopy May 10, 2010. l. d . 2 NA. Naked eye: ~ 50-100 μ m. 1595, Zaccharias and Hans Janssen First microscope, 9x magnification. Antony Van Leeuwenhoek (1632-1723), 200x. Ernst Abbe (1840-1905)

Super-Resolution Optical Microscopy
E N D
Presentation Transcript
Super-Resolution Optical Microscopy Bo Huang Light MicroscopyMay 10, 2010
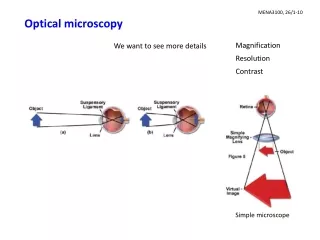
l d 2 NA Naked eye: ~ 50-100 μm 1595, Zaccharias and Hans JanssenFirst microscope, 9x magnification Antony Van Leeuwenhoek(1632-1723), 200x Ernst Abbe (1840-1905) The “physical” diffraction limit Compound microscope >1000x 1600 1700 1800 1900 2000
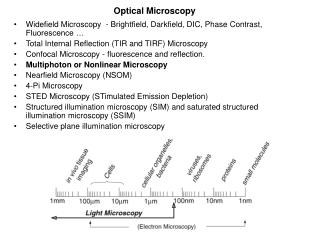
The diffraction barrier Cellular Diffraction limit: ~ 250 nm lateral ~ 600 nm axial Sub-cellular Molecular 1 μm Atomic http://www.3dchem.com; http://cs.stedwards.edu; http://cvcweb.ices.utexas.edu; Fotin et al., Nature 2004; http://hrsbstaff.ednet.ns.ca; http://www.ebi.ac.uk
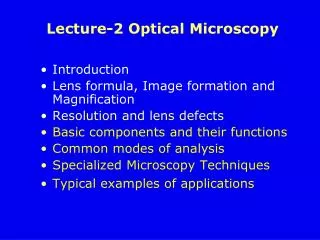
50 years to extend the resolution • Confocal microscopy (1957) • Near-field scanning optical microscopy (1972/1984) • Multiphoton microscopy (1990) • 4-Pi microscopy / I5M (1991-1995) • Structured illumination microscopy (2000) • Negative refractive index (2006)
Near-field scanning optical microscopy β2 adrenergic receptor clusters on the plasma membrane Excitation light Optical fiber ~ 50 nm Aperture Sample Ianoul et al., 2005
l d 2 NA 4-Pi / I5M NA = n sin Major advantage: Similar z resolution as x-y resolution
Patterned illumination Detector Detector = x Excitation Detection x
Structured Illumination Microscopy (SIM) 9 images Reconstruction WF SIM 2 = Gustafsson, J Microscopy 2000
l 1 ³ d · 2 2 NA The diffraction limit still exists Confocal 4Pi / I5M SIM
Breaking the diffraction barrier The Fluorophore! Confocal 4Pi / I5M SIM
Stimulated Emission Depletion (STED) Detector 2h Stimulated Emission Excitation Fluorescence h FL0 Send to a dark state 0 Is
STED microscopy Detector Light modulator Fluorescence Excitation Depletion Stimulated Emission Excitation Excitation STEDpattern EffectivePSF ? ÷ = Hell 1994, Hell 2000
l 1 = d · + 2 NA 1 I / I s Saturated depletion STEDpattern SaturatedDepletion zero point ISTED = 100 IS ISTED = 10 IS ISTED = 2 IS ISTED = IS
STED images of microtubules Wildanger et al., 2009
The “patterned illumination” approach • Ground state • Triplet state • Isomerization • etc. Multiple cycles Excitation Depletionpattern ÷ =
Saturated SIM Fluorescencesaturation FL WF Deconvolution Iex SIM SSIM Saturation level Saturated illumination pattern 50 nm resolution Suffers from fast photobleaching under saturated excitation condition Sharp zero lines Gustaffson, PNAS 2005
Single-Molecule Localization Image of one fluorescent molecule FWHM ≈ 320 nm Yildiz et al., Science, 2003
l d 2 NA Single-molecule localization precision 1 photon 10 photons 100 photons 1000 photons l 1 = d · 2 NA N
Super-resolution imaging by localization STORM Image Conventional fluorescence Raw images Deactivation Activation Localization 2x real time Stochastic Optical Reconstruction Microscopy = STORM Also named as PALM (Betzig et al., Science, 2006) and FPALM (Hess et al., Biophys. J. 2006) Huang et al., Annu Rev Biochem, 2009
+ N N Photoswitching of red cyanine dyes 650 nm Fluorescent + thiol Cy5 / Alexa 647 Deactivation photoactivation 360 nm 650 nm Dark Bates eta l., PRL 2005, Bates et al., Science 2007, Dempsey et al., JACS 2009
B-SC-1 cell, anti-β tubulin Commercial secondary antibody Alexa 647 FWHM = 24 nm stdev = 10 nm 40,000 frames, 1,502,569 localization points 5 μm 500 nm
The “single-molecule switching” approach • Photoswitching • Blinking • Diffusion • Binding • etc. Multiple photons StochasticSwitching + =
STORM probes commercially available or already in your lab 400 500 600 700 nm Cyanine dye + thiol system Alexa647 Cy5.5 Cy7 Cy5 Bates et al., 2005, Bates et al., 2007, Huang et al., 2008 Rhodamine dye + redox system Atto565 Alexa488 Alexa532 Atto590 Atto655 Atto700 Atto520 Alexa568 Heilemann et al., 2009 Photoactivatible fluorescent proteins mEosFP2 PA-GFP PS-CFP2 Dendra2 Dronpa PAmCherry EYFP Reviews: Lukyanov et al., Nat. Rev. Cell Biol., 2005 Lippincott-Schwartz et al., Trends Cell Biol., 2009
In a 2D world… Satellite image of ??? Google maps
3D STED Harke et al., NanoLett, 2008
3D STORM/PALM Astigmatic imaging (x, y, z) (x, y) Huang et al., Science 2008 200 z (nm) -400 -200 0 400 Bi-plane imaging SLM Juette et al., Science 2008 Double-helical PSF EMCCD EMCCD 600 z (nm) -900 -500 0 1400 Pavani et al., PNAS 2009
Scale bar: 200 nm 3D Imaging of the Microtubule Network z (nm) 600 300 0 5 μm Huang, Wang, Bates and Zhuang,Science, 2008
The use of two opposing objectives I5S Shal et al., Biophys J 2008 isoSTED 4Pi scheme Schmidt et al., NanoLett 2009 iPALM Near isotropic3D resolution Shtengel et al., PNAS 2009
Muticolor STED Excitation 2 Excitation 2 color isoSTED resolvingthe inner and outer membraneof mitochondria STED 2 STED 1 µm Schmidt et al., Nat Methods 2008
Multicolor STORM/PALM: Emission n1 = n2 50% SRA545 + 50% SRA617? 100% SRA577? n1 n2 Single-molecule detection! 3-color imaging with one excitation wavelengthand two detection channels Bossi et al., NanoLett 2008
Multicolor STORM/PALM: activation 650 nm Fluorescent Cy5 Cy3 Deactivation photoactivation 360 nm 650 nm Dark Cy5 532 nm Cy3
… … 532 457 █Cy3 / Alexa 647: Clathrin █Cy2 / Alexa 647: Microtubule Crosstalk subtracted Laser sequence Cy3 Cy2 A647 A647 1 μm Bates, Huang, Dempsey and Zhuang,Science, 2007
SIM 2 µm STORM/PALM Kner, Chhun et al., Nat Methods, 2009 STED Schroff et al., Nat Methods, 2008 Nagerl et al., PNAS, 2008
l 1 = d · S 2 NA Unbound theoretical resolution • STORM/PALM • 6,000 photons 5 nm • 100,000 photos during Cy5 life time < 1 nm • STED • 1:100 contrast of the donut 20 nm • Diamond defects: 8 nm S = S = N 1+ I/Is
Effective resolution: Probe size matters Antibodies: ~ 10 nm Fluorescent Proteins:~ 3 nm Small fluorophores: ~ 1 nm Localization precision: 22 nm Measured width by STORM: 56 nm Actual microtubule diameter: 25 nm Bacillus subtilisspore 100 nm 100 nm 500 nm ~ 6000 photons < 1000 photons ~ 6000 photons
STORM: a “time-for-space” strategy Conventional image STORM image … … Time
Effective resolution: Density matters Frames for image reconstruction: 200 500 1,000 5,000 40,000 Nyquist criteria Point to point distance ≈ Feature size Point to point distance < ½ Feature size This labeling density limit of resolution applies to all fluorescence microscopy methods
Effective resolution: Contrast matters 650 nm Fluorescent 1% means… e.g. 1% Sparsely labeled sample Densely labeled sample Deactivation photoactivation 360 nm 650 nm Dark e.g. 99%
Effective resolution: Contrast matters 650 nm Fluorescent 1% means… e.g. 1% Homogeneous sample Microtubule Common blinking dyes: >3% Cy5 + mercaptoethylamine: 0.1-0.2% mEosFP: 0.001% Deactivation photoactivation Average point-to-point distance: 360 nm 650 nm Dark 14 nm 40 nm e.g. 99%
Live cell STORM: Density matters Plasma membrane staining of a BS-C-1 cell Assuming: 1 molecule occupies 500 × 500 nm ↓ On average 0.1 point / 0.25 µm2·frame ↓ 70 nm resolution ≡ 2000 frames ↓ 100 fps = 20 sec time resolution 100x real time 1 μm
100 Number of localizations 50 0 -200 0 200 Displacement / frame (nm) Stochastic switching + particle tracking DiD stained plasma membrane Effective D = 0.66 μm2/s 1 μm 1 μm 1000 frames, 10 sec total time