
SlideServe
Menu
Préférences
© SlideServe · v2026

Quantitative Data Analysis

heather-morgan avatar
11 diapositives · 645 Views · Oct 25, 2014

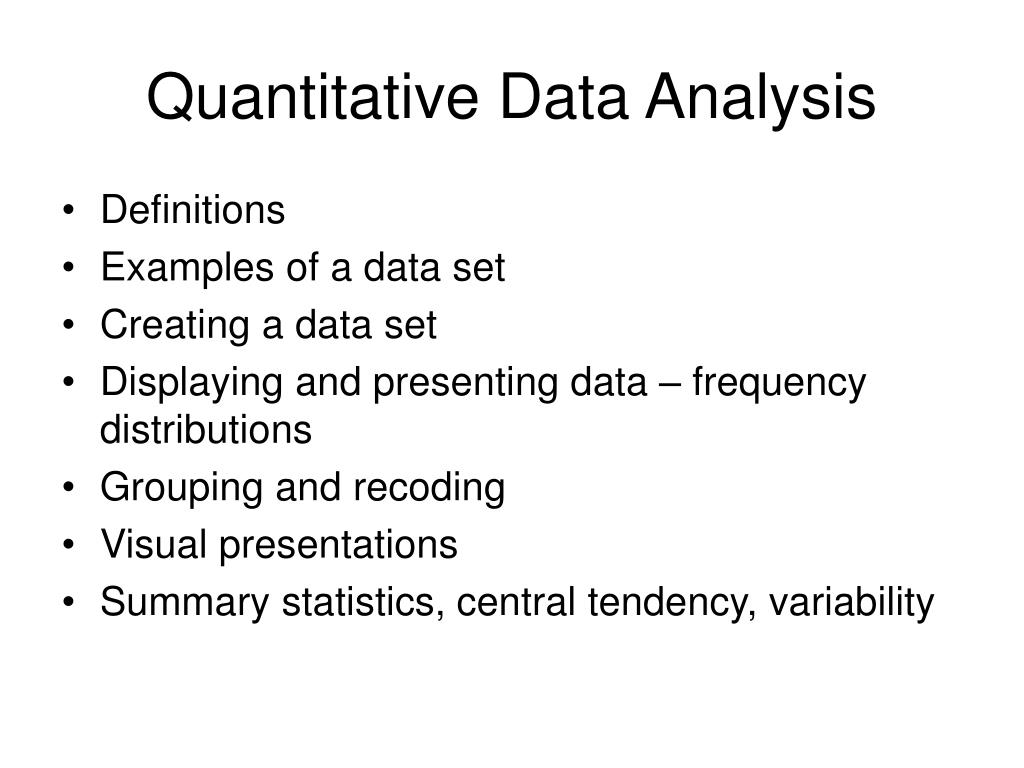
Quantitative Data Analysis. Definitions Examples of a data set Creating a data set Displaying and presenting data – frequency distributions Grouping and recoding Visual presentations Summary statistics, central tendency, variability. What do we analyze?.
Quantitative Data Analysis - slide 1
01 / 11Quantitative Data Analysis
1 / 17

Télécharger la présentation

Quantitative Data Analysis
Une image / un lien ci-dessous est fourni (tel quel) pour télécharger la présentation

Politique de téléchargement : le contenu du site vous est fourni TEL QUEL pour votre information et votre usage personnel ; il ne peut être vendu, concédé sous licence ni partagé sur d’autres sites sans l’accord de son auteur.Le contenu vous est fourni TEL QUEL, pour votre information et votre usage personnel uniquement. Téléchargez la présentation en cliquant sur ce lien. Lors du téléchargement, si vous ne parvenez pas à télécharger une présentation, l’éditeur a peut-être supprimé le fichier de son serveur.Pendant le téléchargement, si vous ne parvenez pas à obtenir une présentation, le fichier a peut-être été supprimé par l’éditeur.

F I N

Plus de contenu associé

Transcription de la présentation
  1. Quantitative Data Analysis • Definitions • Examples of a data set • Creating a data set • Displaying and presenting data – frequency distributions • Grouping and recoding • Visual presentations • Summary statistics, central tendency, variability

  2. What do we analyze? • Variable – characteristic that varies • Data – information on variables (values) • Data set – lists variables, cases, values • Qualitative variable – discrete values, categories. • Frequencies, percentages, proportions • Quantitative variable- range of numerical values • Mean, median, range, standard deviation, etc.

  3. Creating a data set • Enter into a statistical package (program) • Program does calculations and displays results • Examples: census data Data on CD (GSS 2004)http://www.d.umn.edu/~sjanssen/Intro%20to%20SPSS%20exercise.htm

  4. Creating a data set • May involve coding and data entry • Coding = assigning numerical value to each value of a variable • Gender: 1= male, 2 = female • Year in school: 1= freshman, 2= sophomore, etc. • May need codes for missing data (no response, not applicable) • Large data sets come with codebooks

  5. Displaying and Presenting Data • Frequency distribution – list of all possible values of a variable and the # of times each occurs • May require grouping into categories • May include percentages, cumulative frequencies, cumulative percentages

  6. Displaying and Presenting Data • Ungrouped frequency distribution • Usually qualitative variables • Grouped frequency distribution • Values are combined (grouped) into categories • Use for quantitative variables • Many separate values

  7. Grouping into categories • May use meaningful groupings • May use equal intervals (more common) • Equal width • Mutually exclusive • Exhaustive • Class interval = category, range of values • Midpoint = exact middle of interval • Limits = halfway to next interval

  8. Summary statistics • Percent = relative frequencies; standardized units. • Cumulative frequency or percent = frequency at or below a given category (at least ordinal data required)

  9. Visual Presentation of Data • Bar graph (column chart, histogram): best with fewer categories • Pie chart: good for displaying percentages; easily understood by general audience • Line graph: good for numerical variables with many values or for trend data

  10. Summary statistics: central tendency • “Where is the center of the distribution?” • Mode = category with highest frequency • Median = middle category or score • Mean = average score

  11. Summary Statistics: Variability • “Where are the ends of the distribution? How are cases distributed around the middle?” • Range = difference between highest and lowest scores • Standard deviation = measure of variability; involves deviations of scores from mean; most scores fall within one standard deviation above or below mean.