Download
1 / 6
60 likes | 155 Vues
Explore the science behind climate change and its impact on our future energy resources. Discover the complexity of the climate system, from daily weather events to multi-century cycles. Dive into data like the Keeling curve to see the changes in global temperatures over time.

E N D
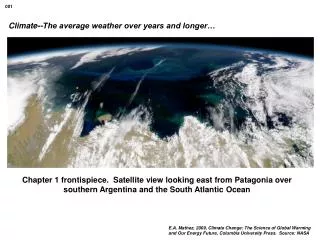
001 Climate--The average weather over years and longer… Chapter 1 frontispiece. Satellite view looking east from Patagonia over southern Argentina and the South Atlantic Ocean E.A. Mathez, 2009, Climate Change: The Science of Global Warming and Our Energy Future, Columbia University Press. Source: NASA
002 ocean: 1000x heat, 50x carbon Chapter 1 frontispiece. Satellite view looking east from Patagonia over southern Argentina and the South Atlantic Ocean E.A. Mathez, 2009, Climate Change: The Science of Global Warming and Our Energy Future, Columbia University Press. Source: NASA
003 Figure 1.1. The dynamic climate system E.A. Mathez, 2009, Climate Change: The Science of Global Warming and Our Energy Future, Columbia University Press.
004 Table 1.1. Different timescales of weather and climate daily warm days, cool nights 3-7 days weather events, e.g., passages of fronts yearly seasons 2-7 years El Niño events (ENSO) 1-3 decades oscillations in atmospheric circulation patterns, e.g., North Atlantic centuries multi-century cold and warm periods 104 - 105 years Milankovitch cycles > 106 years positions of continents, changes in atmospheric composition, changes in solar luminosity E.A. Mathez, 2009, Climate Change: The Science of Global Warming and Our Energy Future, Columbia University Press. Source: Christy et al., 2006
005 Figure 1.2. The Keeling curve E.A. Mathez, 2009, Climate Change: The Science of Global Warming and Our Energy Future, Columbia University Press. Source: Scripps Institution of Oceanography CO2 Program
006 Figure 1.3. The change in the average global land-surface air temperature relative to the 1961–1990 mean temperature E.A. Mathez, 2009, Climate Change: The Science of Global Warming and Our Energy Future, Columbia University Press. Source: Trenbreth et al., 2007