Analyzing Phase Diagrams in Equity Prices and Asset Prices During Liquidity Shocks
50 likes | 167 Vues
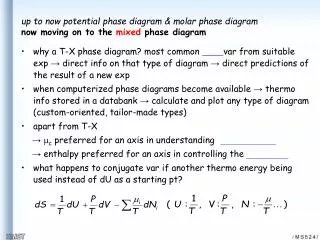
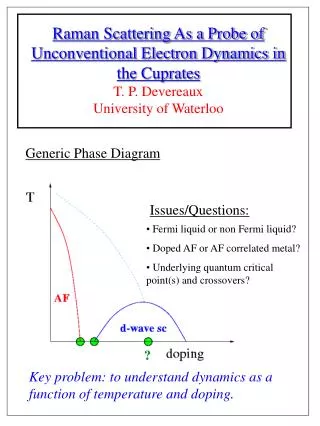
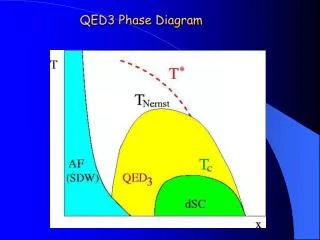
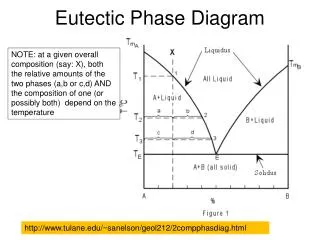
This study examines the phase diagrams of equity and asset prices using Aggregate Market (AM) and Rational Investment (RI) frameworks. We focus on stationary conditions where Δq/Δt = 0 and assess the implications of a stochastic liquidity shock lasting ten quarters. The analysis highlights how stock market declines can lead to recessions as derived from official simulations and analytical equivalents. We discuss the dynamics of capital stock and investment changes, illustrating critical shifts in the equilibrium due to liquidity crises.

Analyzing Phase Diagrams in Equity Prices and Asset Prices During Liquidity Shocks
E N D
Presentation Transcript
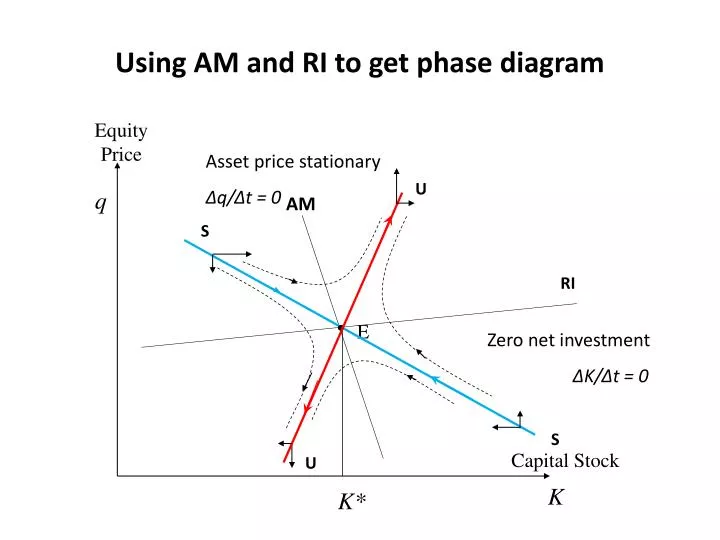
Using AM and RI to get phase diagram Equity Price Asset price stationary Δq/Δt = 0 U q AM S RI E Zero net investment ΔK/Δt = 0 S Capital Stock U K K*
liquidity shock shifts E to E': with stock market fall leading to recession AM AM' q RI' E RI E' I P P K** K* K
Diagram 1. Effect of a stochastic liquidity shock in US that lasts 10 quarters, official simulations and our analytical equivalent.