Understanding Displacement-Time and Velocity-Time Graphs in Motion Analysis
This lesson focuses on the relationship between displacement-time (d-t) graphs and velocity-time (v-t) graphs in analyzing motion. Students will discuss with their team how these graphs are interconnected and what they reveal about an object's movement. The lesson includes an exploration of what a d-t graph looks like for an accelerating object. For instance, if an object moves away from the origin at a constant speed for a certain period and then experiences a slowdown, the effects will be evident in both types of graphs.


Understanding Displacement-Time and Velocity-Time Graphs in Motion Analysis
E N D
Presentation Transcript
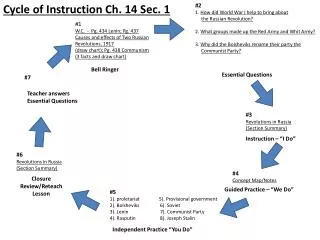
Bell Ringer 30 June 2009
LT: Relate d-t and v-t graphs to descriptions of motion. • Discuss with your team how graphs of d-t and v-t are related to one another. • What does a d-t graph look like for an accelerating object?
Relating d-t and v-t Graphs • Object moves away from origin at a speed of xxx for yyy sec, then slows to zzz from aaa to bbb sec.